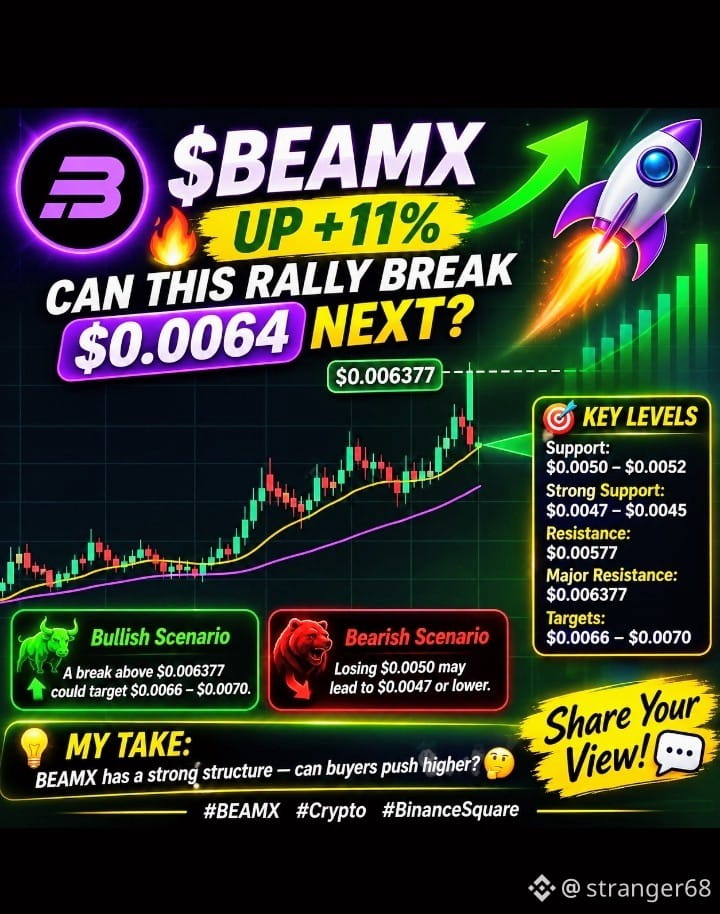
🚀 $BEAMX UP +11% — CAN THIS RALLY BREAK $0.0064 NEXT? 🔥
💥 BEAMX is showing impressive strength after a powerful breakout, climbing to $0.00538 with a 24H gain of over 11%. Trading volume has also picked up, but can buyers push for another leg higher? ⚡
⏱️ 1H Chart: Price is holding around $0.00538, recovering above the short-term moving averages. However, momentum is cooling slightly, making $0.0050–$0.0052 an important support zone. 📊
🕓 4H Chart: The broader structure remains strong, with price trading above MA(25) and MA(99). Holding $0.0047–$0.0050 could help maintain the recovery. 🟢
📅 1D Chart: The bigger picture looks impressive! Price has accelerated sharply, while MACD remains positive. The daily trend still favors buyers, although some consolidation would be healthy after this rally. 🌟
🎯 KEY LEVELS
- Support: $0.0050–$0.0052
- Strong support: $0.0047–$0.0045
- Resistance: $0.00577
- Major resistance: $0.006377
- Breakout targets: $0.0066–$0.0070
🚀 Bullish scenario: A strong break above $0.006377 could open the door toward $0.0066–$0.0070.
⚠️ Bearish scenario: Losing $0.0050 could trigger another pullback toward $0.0047 or lower.
💡 MY TAKE: BEAMX has a strong daily structure, but short-term momentum needs to recover. I'm watching whether buyers can defend support and challenge the recent high. 📈
🔥 Can BEAMX smash through $0.006377, or will sellers force another cooldown? Share your view below! 💬
#BEAMX #Crypto #BinanceSquare
#BinanceToResumePhaseOneOfWithdrawals #IntelHasItsWorstDaySince1974 #BinanceUpdatesProofofReservesAddresses #CZDismissesClaimsBinanceHackWasPredicted
💥 BEAMX is showing impressive strength after a powerful breakout, climbing to $0.00538 with a 24H gain of over 11%. Trading volume has also picked up, but can buyers push for another leg higher? ⚡
⏱️ 1H Chart: Price is holding around $0.00538, recovering above the short-term moving averages. However, momentum is cooling slightly, making $0.0050–$0.0052 an important support zone. 📊
🕓 4H Chart: The broader structure remains strong, with price trading above MA(25) and MA(99). Holding $0.0047–$0.0050 could help maintain the recovery. 🟢
📅 1D Chart: The bigger picture looks impressive! Price has accelerated sharply, while MACD remains positive. The daily trend still favors buyers, although some consolidation would be healthy after this rally. 🌟
🎯 KEY LEVELS
- Support: $0.0050–$0.0052
- Strong support: $0.0047–$0.0045
- Resistance: $0.00577
- Major resistance: $0.006377
- Breakout targets: $0.0066–$0.0070
🚀 Bullish scenario: A strong break above $0.006377 could open the door toward $0.0066–$0.0070.
⚠️ Bearish scenario: Losing $0.0050 could trigger another pullback toward $0.0047 or lower.
💡 MY TAKE: BEAMX has a strong daily structure, but short-term momentum needs to recover. I'm watching whether buyers can defend support and challenge the recent high. 📈
🔥 Can BEAMX smash through $0.006377, or will sellers force another cooldown? Share your view below! 💬
#BEAMX #Crypto #BinanceSquare
#BinanceToResumePhaseOneOfWithdrawals #IntelHasItsWorstDaySince1974 #BinanceUpdatesProofofReservesAddresses #CZDismissesClaimsBinanceHackWasPredicted