$HYPE This early-morning move has something to it.
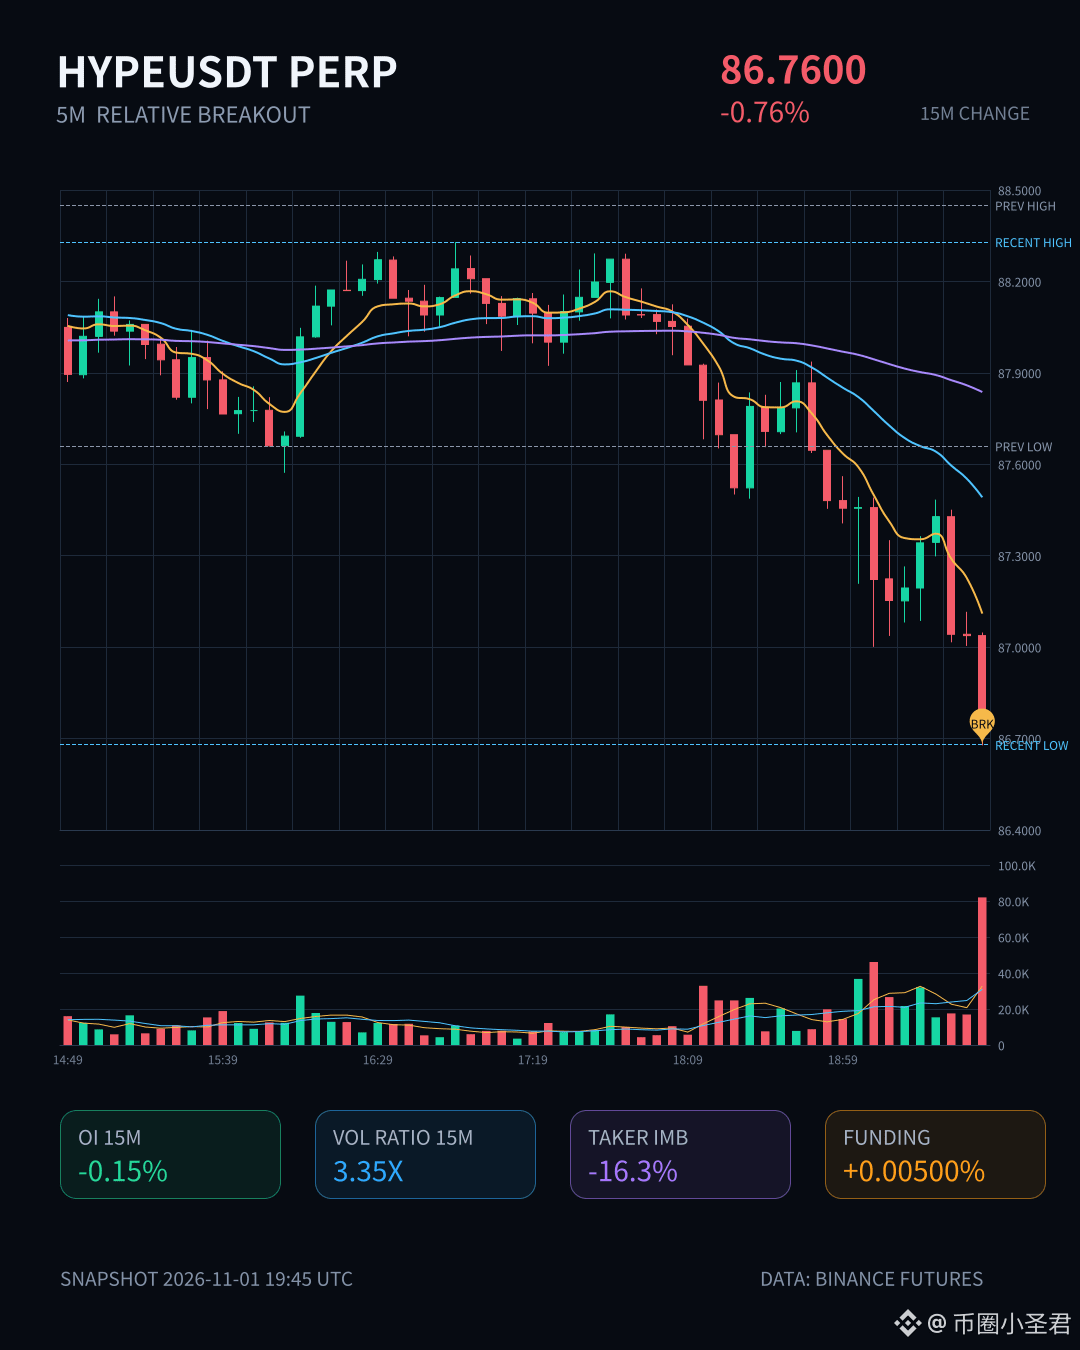
On the 15m chart, price broke straight below the bottom of the range from nearly 20 recent 5m candles. Volume surged to 3.35x normal, taker buy/sell delta was -16.3%, and the buy/sell ratio was 0.72. Sellers are genuinely dumping—not just using sell orders to scare people.
But the interesting part is OI: down 0.15% on the 15m and 0.03% on the 1h, with notional changes of several million U downward. Price down + OI down is a classic long deleveraging pattern, driven by stop-losses and passive position reductions—not new shorts entering the market.
The anomaly percentile is 84.1%, ranking #15 across the entire pool; notional change ranks #2, and the funding rate is still in a high percentile relative to recent levels. This pattern has persisted across multiple consecutive intervals, so I’d avoid catching the falling knife for now and wait until leverage has been flushed out and OI stabilizes before reassessing.
On the 15m chart, price broke straight below the bottom of the range from nearly 20 recent 5m candles. Volume surged to 3.35x normal, taker buy/sell delta was -16.3%, and the buy/sell ratio was 0.72. Sellers are genuinely dumping—not just using sell orders to scare people.
But the interesting part is OI: down 0.15% on the 15m and 0.03% on the 1h, with notional changes of several million U downward. Price down + OI down is a classic long deleveraging pattern, driven by stop-losses and passive position reductions—not new shorts entering the market.
The anomaly percentile is 84.1%, ranking #15 across the entire pool; notional change ranks #2, and the funding rate is still in a high percentile relative to recent levels. This pattern has persisted across multiple consecutive intervals, so I’d avoid catching the falling knife for now and wait until leverage has been flushed out and OI stabilizes before reassessing.