
Technical chart analysis 📊
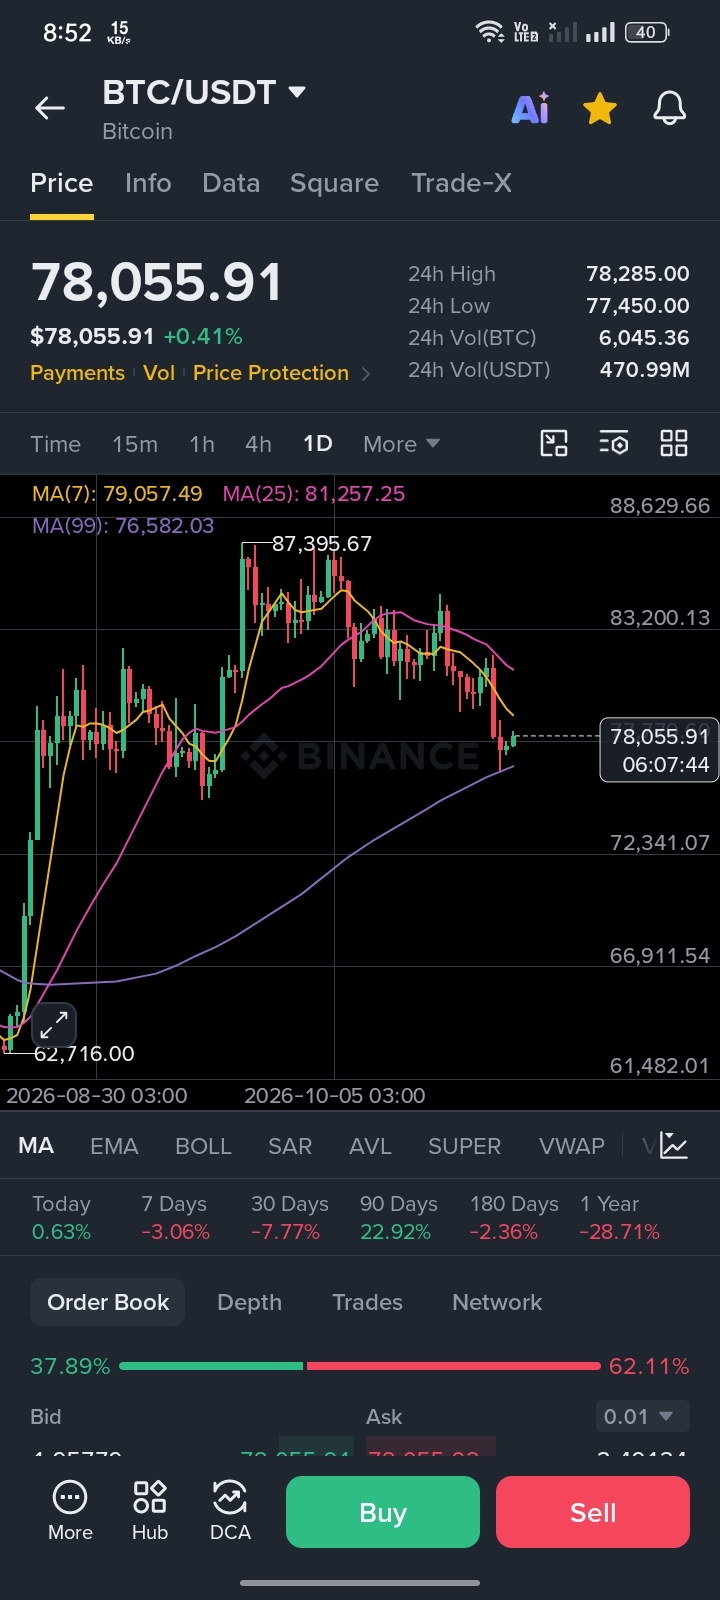
Current price: $78,055.91
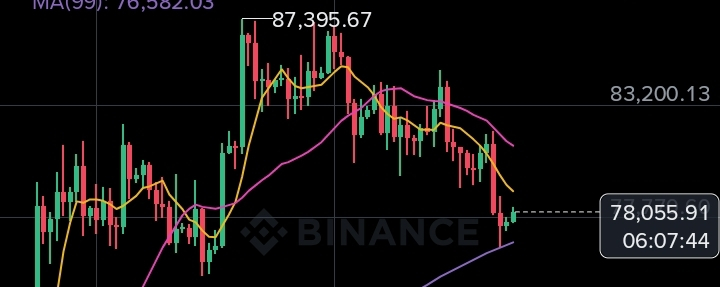
MA(7): $79,057 (above)
MA(25): $81,257 (above)
MA(99): $76,582 (below)
📉 There is short-term pressure, but long-term support is holding.
Key levels:
✅ Support: $76,500–$77,000
🔴 Resistance 1: $79,000–$79,500
🔴 Resistance 2: $81,000–$81,500
Plan:
If the $76,500 support holds, consider a small Spot Buy.