$BTC
#TOTALMARKET1
@
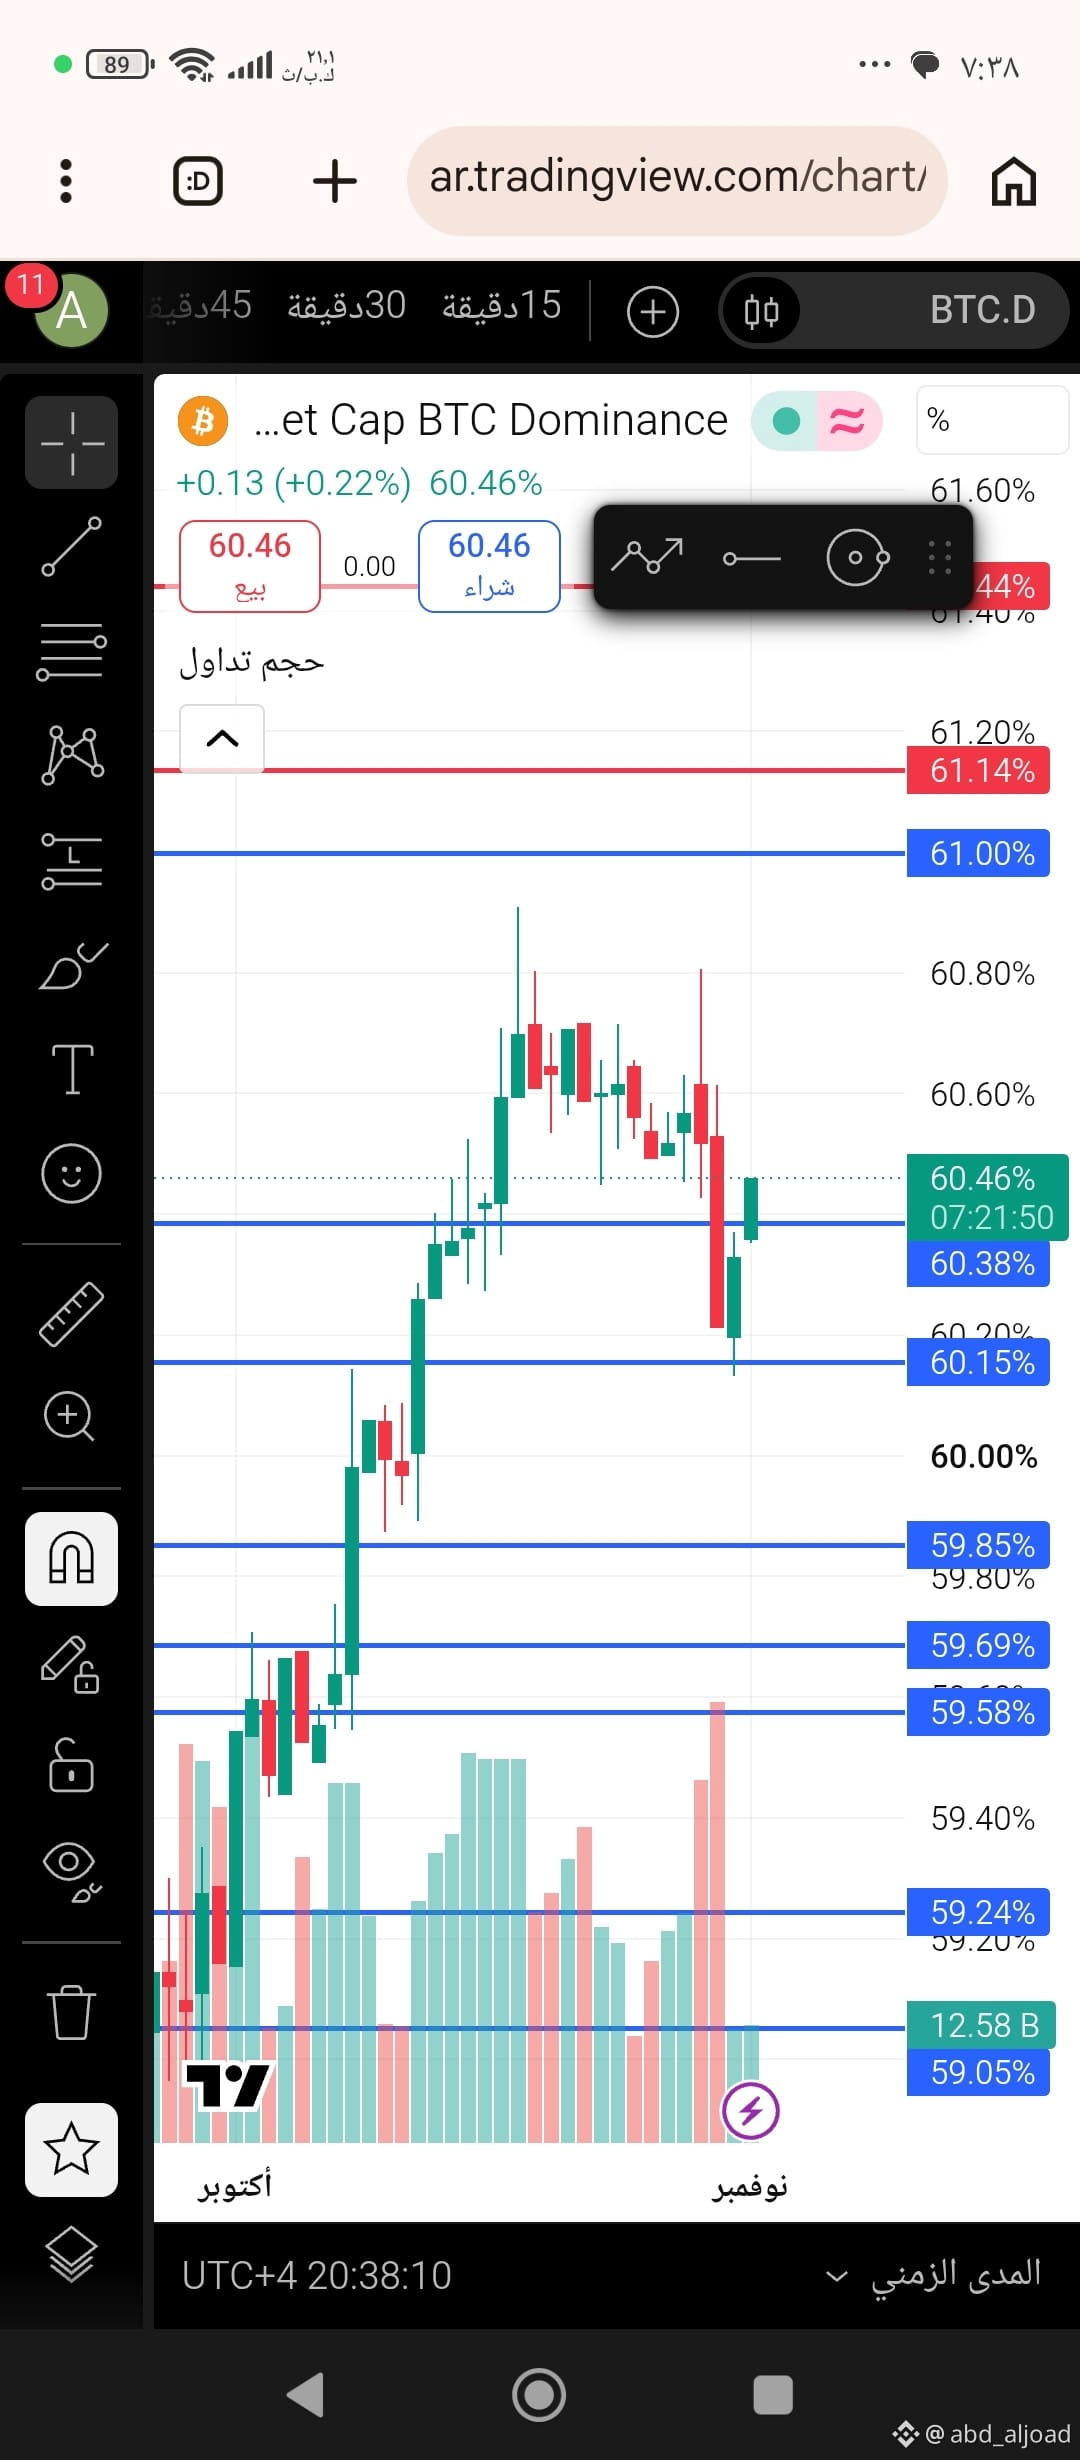
Please be careful. This is just an advance warning about the appearance of one of the rare situations on the market cap chart.
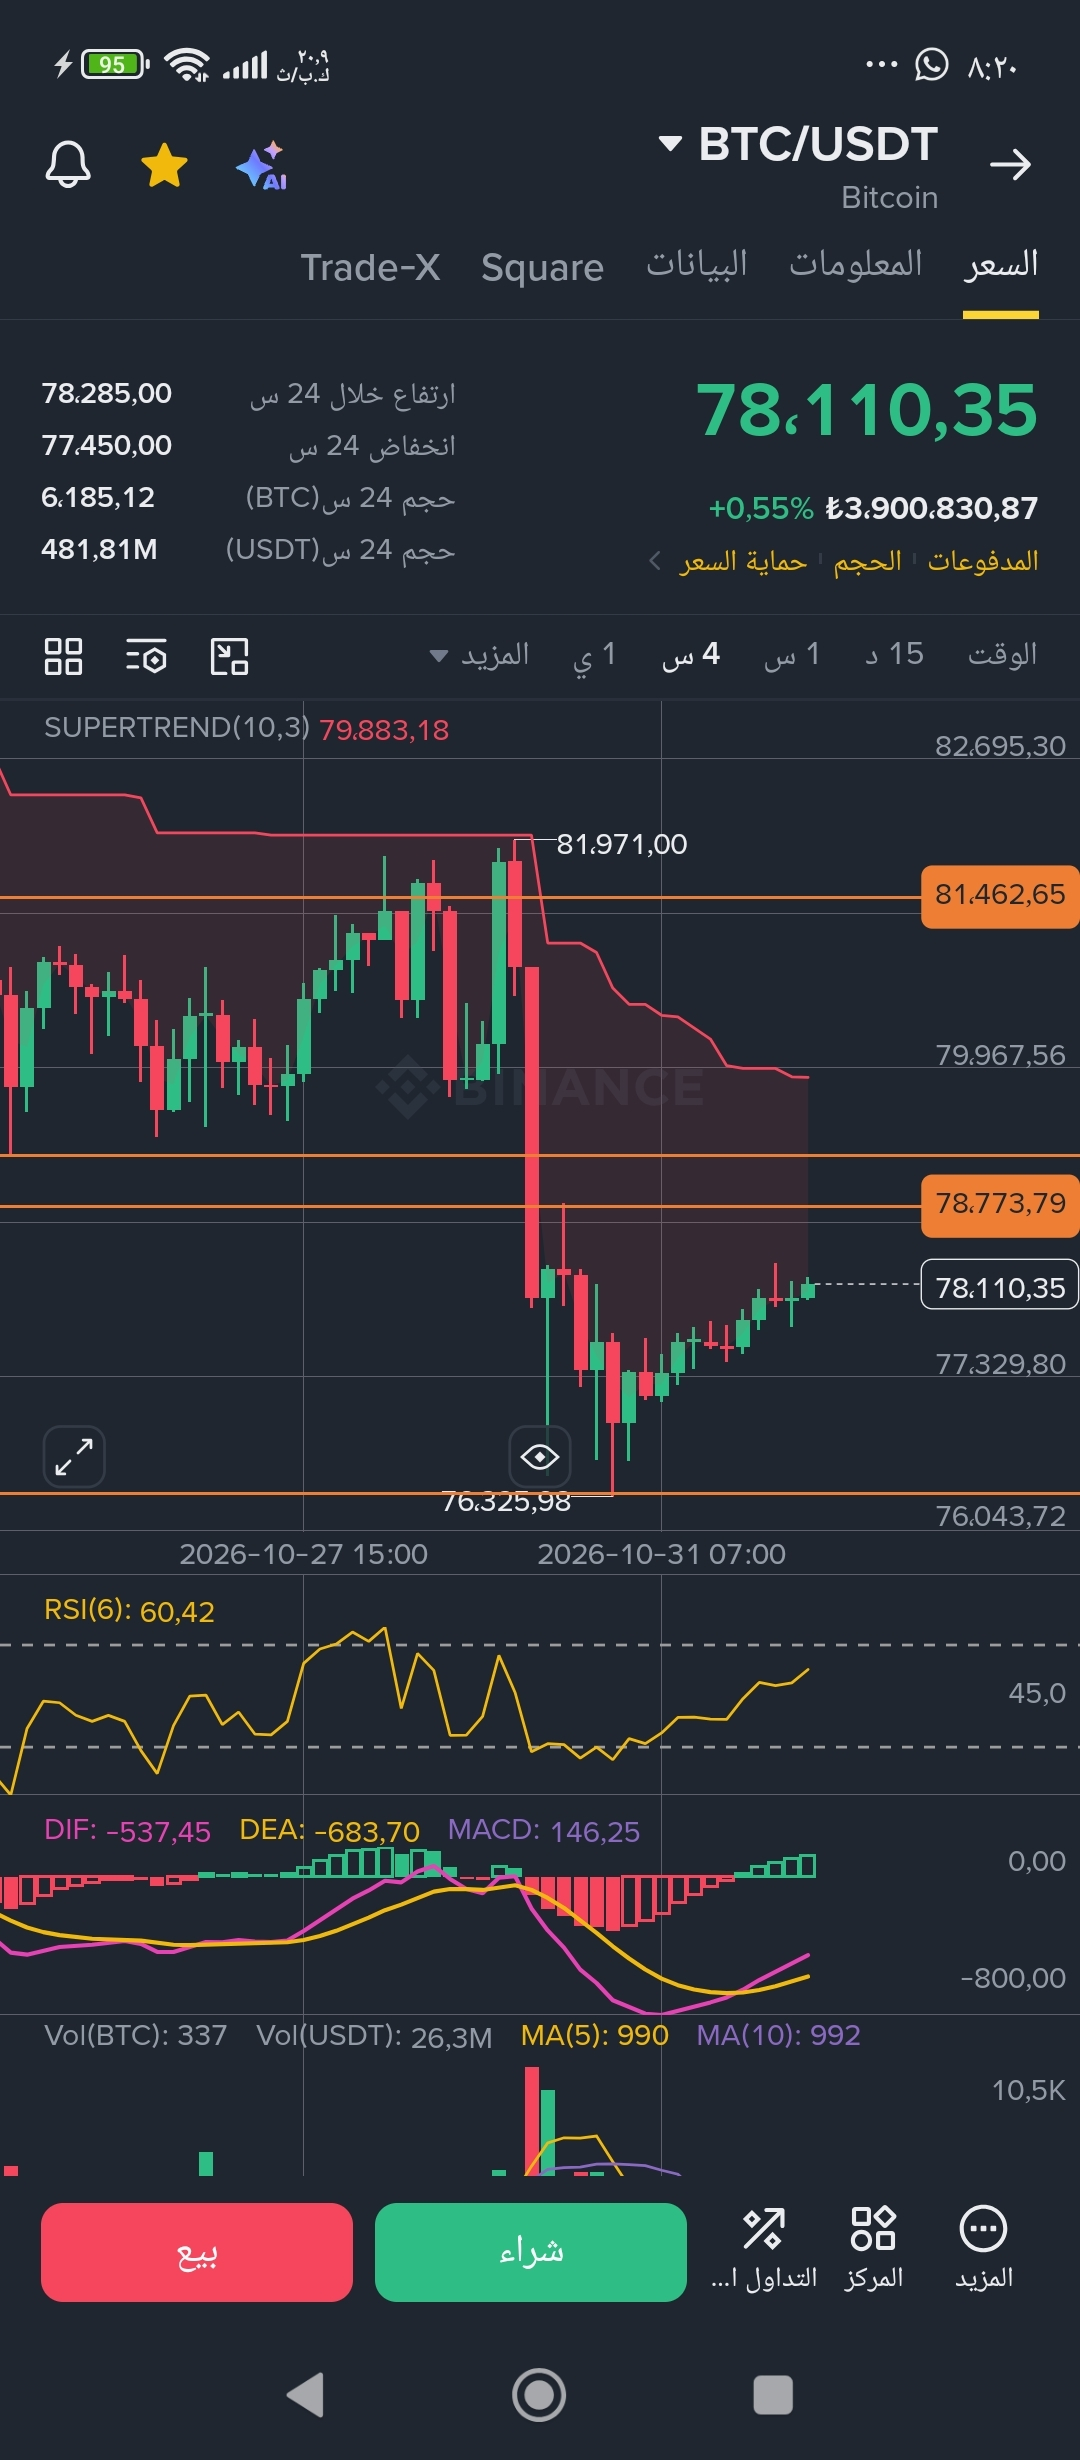
Bitcoin is currently trading at
78110
Are we seeing a genuine rise and recovery, or a false upward move driven by fake liquidity, engineered by hidden hands? Let’s follow what this rare occurrence has in store for us, especially given that it is happening at this particular time—a rare situation.
totat1
The chart opens with a price anomaly. Was real liquidity actually injected at the moment today’s candle closed and opened, causing this anomaly?
Or is there something hidden behind this liquidity injection, at a time that cannot be ignored, coinciding with the daily candle’s close and open and causing this price anomaly—luring the market and traders into a false rally?
Let’s keep watching.
Pay no attention to what I share with you, and don’t base any financial decisions on it. This is only my personal technical reading of the market’s drivers. Do your own research and make your own decisions.
God knows best.
Good luck to everyone.
#TOTALMARKET1
@
Please be careful. This is just an advance warning about the appearance of one of the rare situations on the market cap chart.
Bitcoin is currently trading at
78110
Are we seeing a genuine rise and recovery, or a false upward move driven by fake liquidity, engineered by hidden hands? Let’s follow what this rare occurrence has in store for us, especially given that it is happening at this particular time—a rare situation.
totat1
The chart opens with a price anomaly. Was real liquidity actually injected at the moment today’s candle closed and opened, causing this anomaly?
Or is there something hidden behind this liquidity injection, at a time that cannot be ignored, coinciding with the daily candle’s close and open and causing this price anomaly—luring the market and traders into a false rally?
Let’s keep watching.
Pay no attention to what I share with you, and don’t base any financial decisions on it. This is only my personal technical reading of the market’s drivers. Do your own research and make your own decisions.
God knows best.
Good luck to everyone.