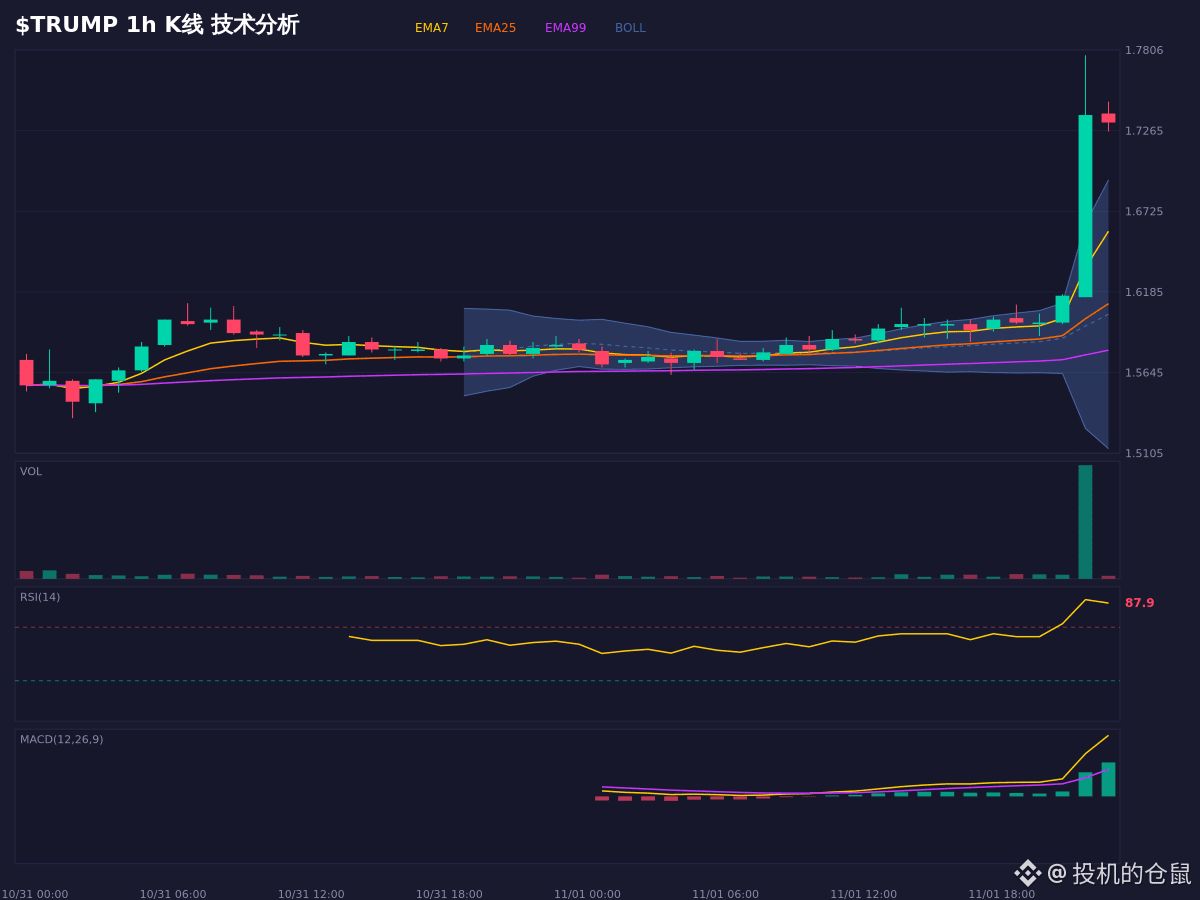
$TRUMP This rally is indeed strong, but a closer look reveals two clear conflicting signals.
First, the moving averages are in bullish alignment: EMA7 > EMA25 > EMA99, so the trend is indeed strong. However, the 1H RSI has surged to 90.1, deep in overbought territory, creating substantial short-term pullback pressure. Historically, after such a sharp rise and overbought conditions, the market often goes through a period of consolidation.
The current price of 1.7360 has broken above the upper Bollinger Band at 1.6952, but there is a clear divergence between the candlesticks and the indicators. If the price holds above the 1.6700 support, the bullish structure may continue; if it falls below the key 1.6001 level, the current bullish outlook is invalidated.
This is for market observation and conditional scenario analysis only; it is not a record of trading activity.
$TRUMP #永续合约 #行情分析 #Trading
First, the moving averages are in bullish alignment: EMA7 > EMA25 > EMA99, so the trend is indeed strong. However, the 1H RSI has surged to 90.1, deep in overbought territory, creating substantial short-term pullback pressure. Historically, after such a sharp rise and overbought conditions, the market often goes through a period of consolidation.
The current price of 1.7360 has broken above the upper Bollinger Band at 1.6952, but there is a clear divergence between the candlesticks and the indicators. If the price holds above the 1.6700 support, the bullish structure may continue; if it falls below the key 1.6001 level, the current bullish outlook is invalidated.
This is for market observation and conditional scenario analysis only; it is not a record of trading activity.
$TRUMP #永续合约 #行情分析 #Trading