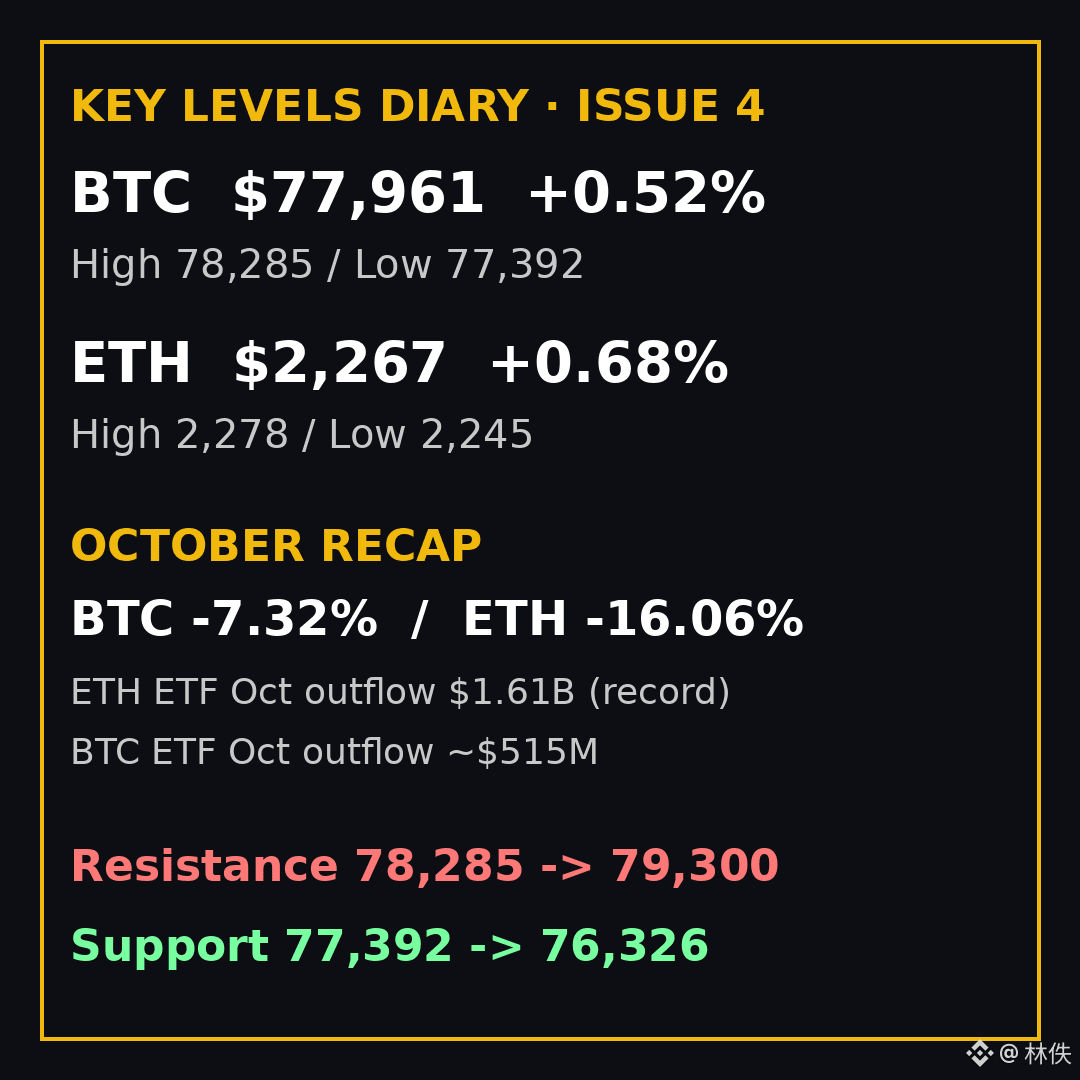
Yesterday's call: I said that a break below 76,326 would mean the bearish trend continued. Today's intraday low was 77,392, so it didn't break below; the high of 78,285 reached the first resistance, but price also failed to reclaim 79,300. The bearish continuation didn't materialize, and the market is still range-bound; bearish momentum has weakened further.
《Key Levels Journal · Issue 4》
October wrap-up: BTC fell 7.32% and ETH fell 16.06%. ETH ETFs saw record outflows of $1.61 billion for the month. Institutions really did pull back in October, but prices didn't make new lows today. Is the decline running out of steam, or is this just a pause before the next leg down?
• Data highlights: BTC fell 7.32% and ETH fell 16.06% in October (SoSoValue figures, monthly recap on November 1); U.S. spot ETH ETFs saw net outflows of about $1.61 billion in October, a monthly record, while BTC ETFs saw net outflows of about $515 million
• Current price and market action: BTC around 77,961, intraday high 78,285 / low 77,392, opened at 77,559, up about 0.52%, still trading sideways below 79,300
• Key levels today: Resistance 78,285 → 79,300; support 77,392 → 76,326
• Personal view (conditional): Still bearish, but with weakening momentum; the bearish outlook only pauses if the daily close reclaims 79,300
• Invalidation level: A daily close above 79,300 would pause the bearish outlook; a break below 76,326 would signal bearish continuation, with 74,900 as the next downside target
• ETH correlation: ETH around 2,267, intraday high 2,278 / low 2,245, up about 0.68%, also moving sideways near the lows and waiting for BTC to confirm direction
《Key Levels Journal》 revisits the previous day's call each evening. Follow for updates.
Personal views only; not investment advice. Leverage carries liquidation risk; make your own decisions. Tonight, will price hit 79,300 first or test 76,326 first? Hit 79,300 first / Test 76,326 first #Bitcoin #以太坊 $BTC $ETH
《Key Levels Journal · Issue 4》
October wrap-up: BTC fell 7.32% and ETH fell 16.06%. ETH ETFs saw record outflows of $1.61 billion for the month. Institutions really did pull back in October, but prices didn't make new lows today. Is the decline running out of steam, or is this just a pause before the next leg down?
• Data highlights: BTC fell 7.32% and ETH fell 16.06% in October (SoSoValue figures, monthly recap on November 1); U.S. spot ETH ETFs saw net outflows of about $1.61 billion in October, a monthly record, while BTC ETFs saw net outflows of about $515 million
• Current price and market action: BTC around 77,961, intraday high 78,285 / low 77,392, opened at 77,559, up about 0.52%, still trading sideways below 79,300
• Key levels today: Resistance 78,285 → 79,300; support 77,392 → 76,326
• Personal view (conditional): Still bearish, but with weakening momentum; the bearish outlook only pauses if the daily close reclaims 79,300
• Invalidation level: A daily close above 79,300 would pause the bearish outlook; a break below 76,326 would signal bearish continuation, with 74,900 as the next downside target
• ETH correlation: ETH around 2,267, intraday high 2,278 / low 2,245, up about 0.68%, also moving sideways near the lows and waiting for BTC to confirm direction
《Key Levels Journal》 revisits the previous day's call each evening. Follow for updates.
Personal views only; not investment advice. Leverage carries liquidation risk; make your own decisions. Tonight, will price hit 79,300 first or test 76,326 first? Hit 79,300 first / Test 76,326 first #Bitcoin #以太坊 $BTC $ETH