BNB/USDT Market Update: Bulls Eye $720 Breakout 🚀
$BNB
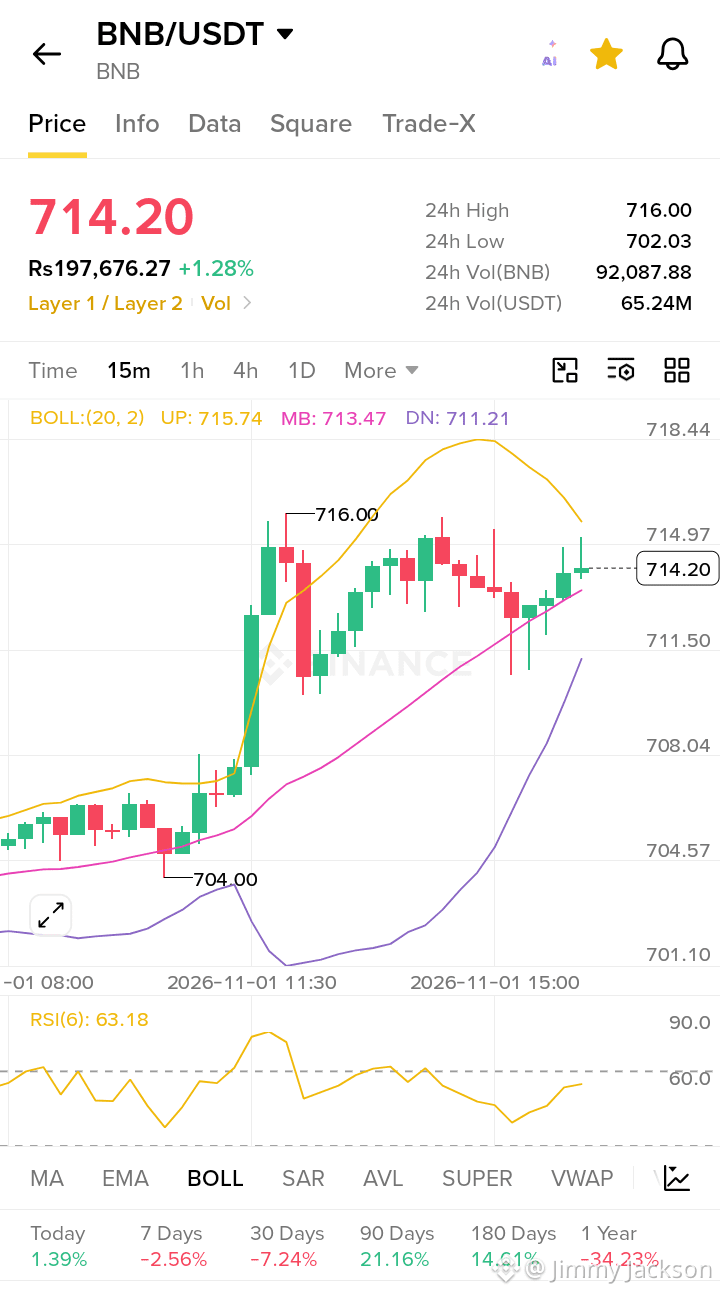
BNB is showing impressive relative strength today, currently trading around $714.20 (+1.28%) on the 15-minute chart. After a sharp impulse from the $704 support zone, the price is consolidating near local highs. Here is the deep dive into why momentum is shifting bullish.
1. On-Chain & Institutional Tailwinds 🐋
While retail waits, smart money is moving. We are seeing whale accumulation patterns return to the BNB ecosystem, fueled by the recent surge in BSC meme coin activity and DeFi volumes. Additionally, broader market sentiment is being lifted by positive ETF flows across the crypto sector, pushing liquidity back into top-tier Layer 1 assets.
2. Technical Breakout Levels 📈
The chart shows a classic "flag" formation after a breakout.
· Immediate Resistance: The 24h high at $716.00 is the critical ceiling. A 15m candle close above this level could trigger a rapid move toward $725.
· Key Support: The middle Bollinger Band is holding strong at $713.47. However, the "must-hold" floor for bulls remains $704.00.
· Indicators: RSI (6) is at 63, leaving room for upward movement before hitting overbought territory. Bollinger Bands are expanding, signaling volatility incoming.
3. Derivatives
Short Liquidation Cascade 💥
The derivatives market is adding fuel to the fire. With open interest rising, we are witnessing a short squeeze scenario. As price cleared the $710 psychological level, liquidations of short positions accelerated, forcing market makers to buy back, creating a feedback loop of upward pressure. If BNB flips $716, expect a heavy liquidation of shorts targeting $720+.
Key Targets
✅ Bullish: $716 flip → $725 / $732
❌ Invalidation Drop below $704→ Retest $695
Please don’t forget to like, follow, and share! 🩸 Thank you so much ❤️
#BinanceUpdatesProofofReservesAddresses #BinanceToResumePhaseOneOfWithdrawals #BinanceSAFUFundTransferCompleted7499BTC
$BNB
BNB is showing impressive relative strength today, currently trading around $714.20 (+1.28%) on the 15-minute chart. After a sharp impulse from the $704 support zone, the price is consolidating near local highs. Here is the deep dive into why momentum is shifting bullish.
1. On-Chain & Institutional Tailwinds 🐋
While retail waits, smart money is moving. We are seeing whale accumulation patterns return to the BNB ecosystem, fueled by the recent surge in BSC meme coin activity and DeFi volumes. Additionally, broader market sentiment is being lifted by positive ETF flows across the crypto sector, pushing liquidity back into top-tier Layer 1 assets.
2. Technical Breakout Levels 📈
The chart shows a classic "flag" formation after a breakout.
· Immediate Resistance: The 24h high at $716.00 is the critical ceiling. A 15m candle close above this level could trigger a rapid move toward $725.
· Key Support: The middle Bollinger Band is holding strong at $713.47. However, the "must-hold" floor for bulls remains $704.00.
· Indicators: RSI (6) is at 63, leaving room for upward movement before hitting overbought territory. Bollinger Bands are expanding, signaling volatility incoming.
3. Derivatives
Short Liquidation Cascade 💥
The derivatives market is adding fuel to the fire. With open interest rising, we are witnessing a short squeeze scenario. As price cleared the $710 psychological level, liquidations of short positions accelerated, forcing market makers to buy back, creating a feedback loop of upward pressure. If BNB flips $716, expect a heavy liquidation of shorts targeting $720+.
Key Targets
✅ Bullish: $716 flip → $725 / $732
❌ Invalidation Drop below $704→ Retest $695
Please don’t forget to like, follow, and share! 🩸 Thank you so much ❤️
#BinanceUpdatesProofofReservesAddresses #BinanceToResumePhaseOneOfWithdrawals #BinanceSAFUFundTransferCompleted7499BTC