Why the BTC Pump? Deep Analysis & New Intel 🔍
$BTC
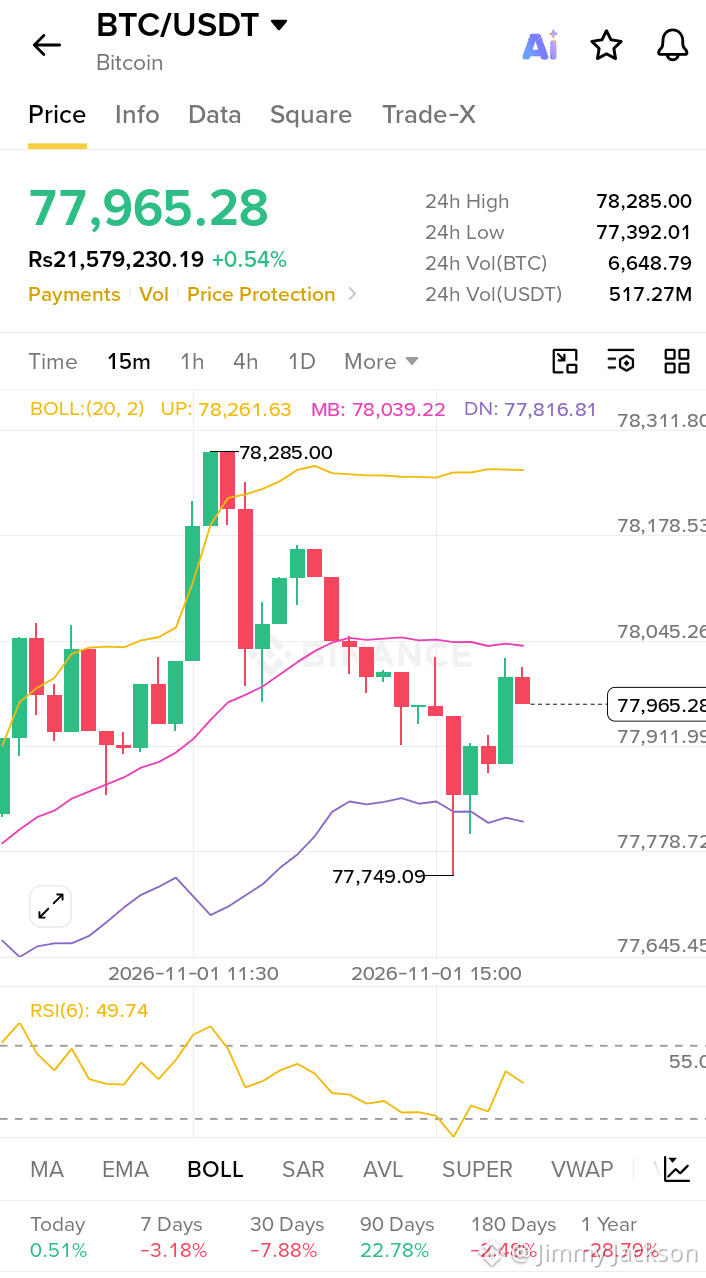
Looking at the 15m chart, BTC is showing a classic volatility squeeze. We bounced sharply off the 77,749 support level, with price currently testing the midline of the Bollinger Bands at 77,965.
The Technicals
The candle wicks down to 77.7k show aggressive dip buying. The BOLL bands are tightening, which usually precedes a breakout. RSI is sitting neutral at 49.74—meaning we aren’t overbought yet and have room to run upward. If we hold this midline, the next local target is the upper band at 78,263.
The "New Info" Catalyst (Fundamentals):
While the chart looks bullish, the real fuel is macro. Recent massive ETF inflows and institutional accumulation are absorbing sell pressure. Furthermore, liquidity is thinning out, causing short squeezes on the 15m timeframe—notice how quickly red candles flip to green.
Deep Analysis
This isn't just a random pump it's a liquidity grab. The market maker swept the lows (77.3k) to trap short sellers, and now they are fueling the bounce. However, with the 30-day trend down -7.88%, treat this as a relief rally until we break 78,300 decisively. Watch the volume!
Please don’t forget to like, follow, and share! 🩸 Thank you so much ❤️
#BinanceUpdatesProofofReservesAddresses #BinanceToResumePhaseOneOfWithdrawals #BinanceSAFUFundTransferCompleted7499BTC
$BTC
Looking at the 15m chart, BTC is showing a classic volatility squeeze. We bounced sharply off the 77,749 support level, with price currently testing the midline of the Bollinger Bands at 77,965.
The Technicals
The candle wicks down to 77.7k show aggressive dip buying. The BOLL bands are tightening, which usually precedes a breakout. RSI is sitting neutral at 49.74—meaning we aren’t overbought yet and have room to run upward. If we hold this midline, the next local target is the upper band at 78,263.
The "New Info" Catalyst (Fundamentals):
While the chart looks bullish, the real fuel is macro. Recent massive ETF inflows and institutional accumulation are absorbing sell pressure. Furthermore, liquidity is thinning out, causing short squeezes on the 15m timeframe—notice how quickly red candles flip to green.
Deep Analysis
This isn't just a random pump it's a liquidity grab. The market maker swept the lows (77.3k) to trap short sellers, and now they are fueling the bounce. However, with the 30-day trend down -7.88%, treat this as a relief rally until we break 78,300 decisively. Watch the volume!
Please don’t forget to like, follow, and share! 🩸 Thank you so much ❤️
#BinanceUpdatesProofofReservesAddresses #BinanceToResumePhaseOneOfWithdrawals #BinanceSAFUFundTransferCompleted7499BTC