
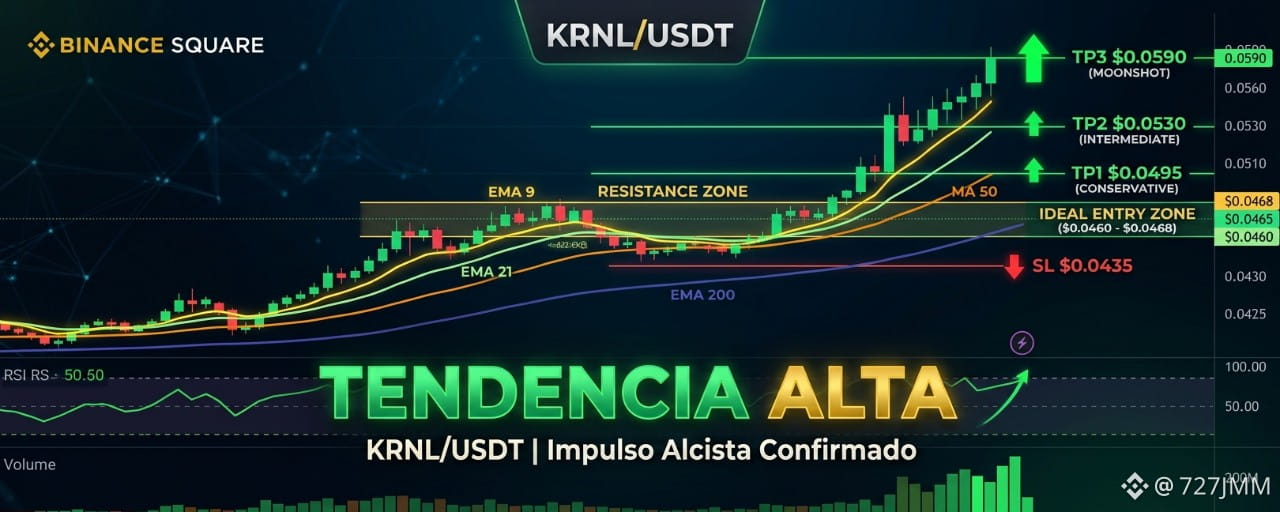


Market Situation Analysis
On the daily timeframe, KERNEL is consolidating a solid bullish structure after breaking through previous accumulation zones; the EMA 9 is holding firmly above the EMA 21, while the MA 50 is acting as institutional dynamic support.
On the 15m and 5m charts, we’re seeing a healthy technical pullback that has cooled the RSI from levels near overbought down to the mid-52 range, where it has found precise confluence with the EMA 21. Volume during this corrective move has declined significantly, confirming that this is simply a pause rather than distribution.
Trade Setup
Ideal Entry Zone: $0.0460 – $0.0468 USDT
TP1 (Conservative): $0.0495 USDT
TP2 (Intermediate): $0.0530 USDT
TP3 (Moonshot): $0.0590 USDT
Stop Loss (SL): $0.0435 USDT (Mandatory)
Trade Range & Justification
We are taking a position in this range, taking advantage of a technical bounce coinciding with the 21 EMA on the 15-minute chart and the psychological support level at $0.0460. The RSI shows a clear momentum reset after emerging from short-term exhaustion, supported by the asset’s main bullish trend. The market structure shows flawless higher lows.