Trading Outlook | 11/1 18:20
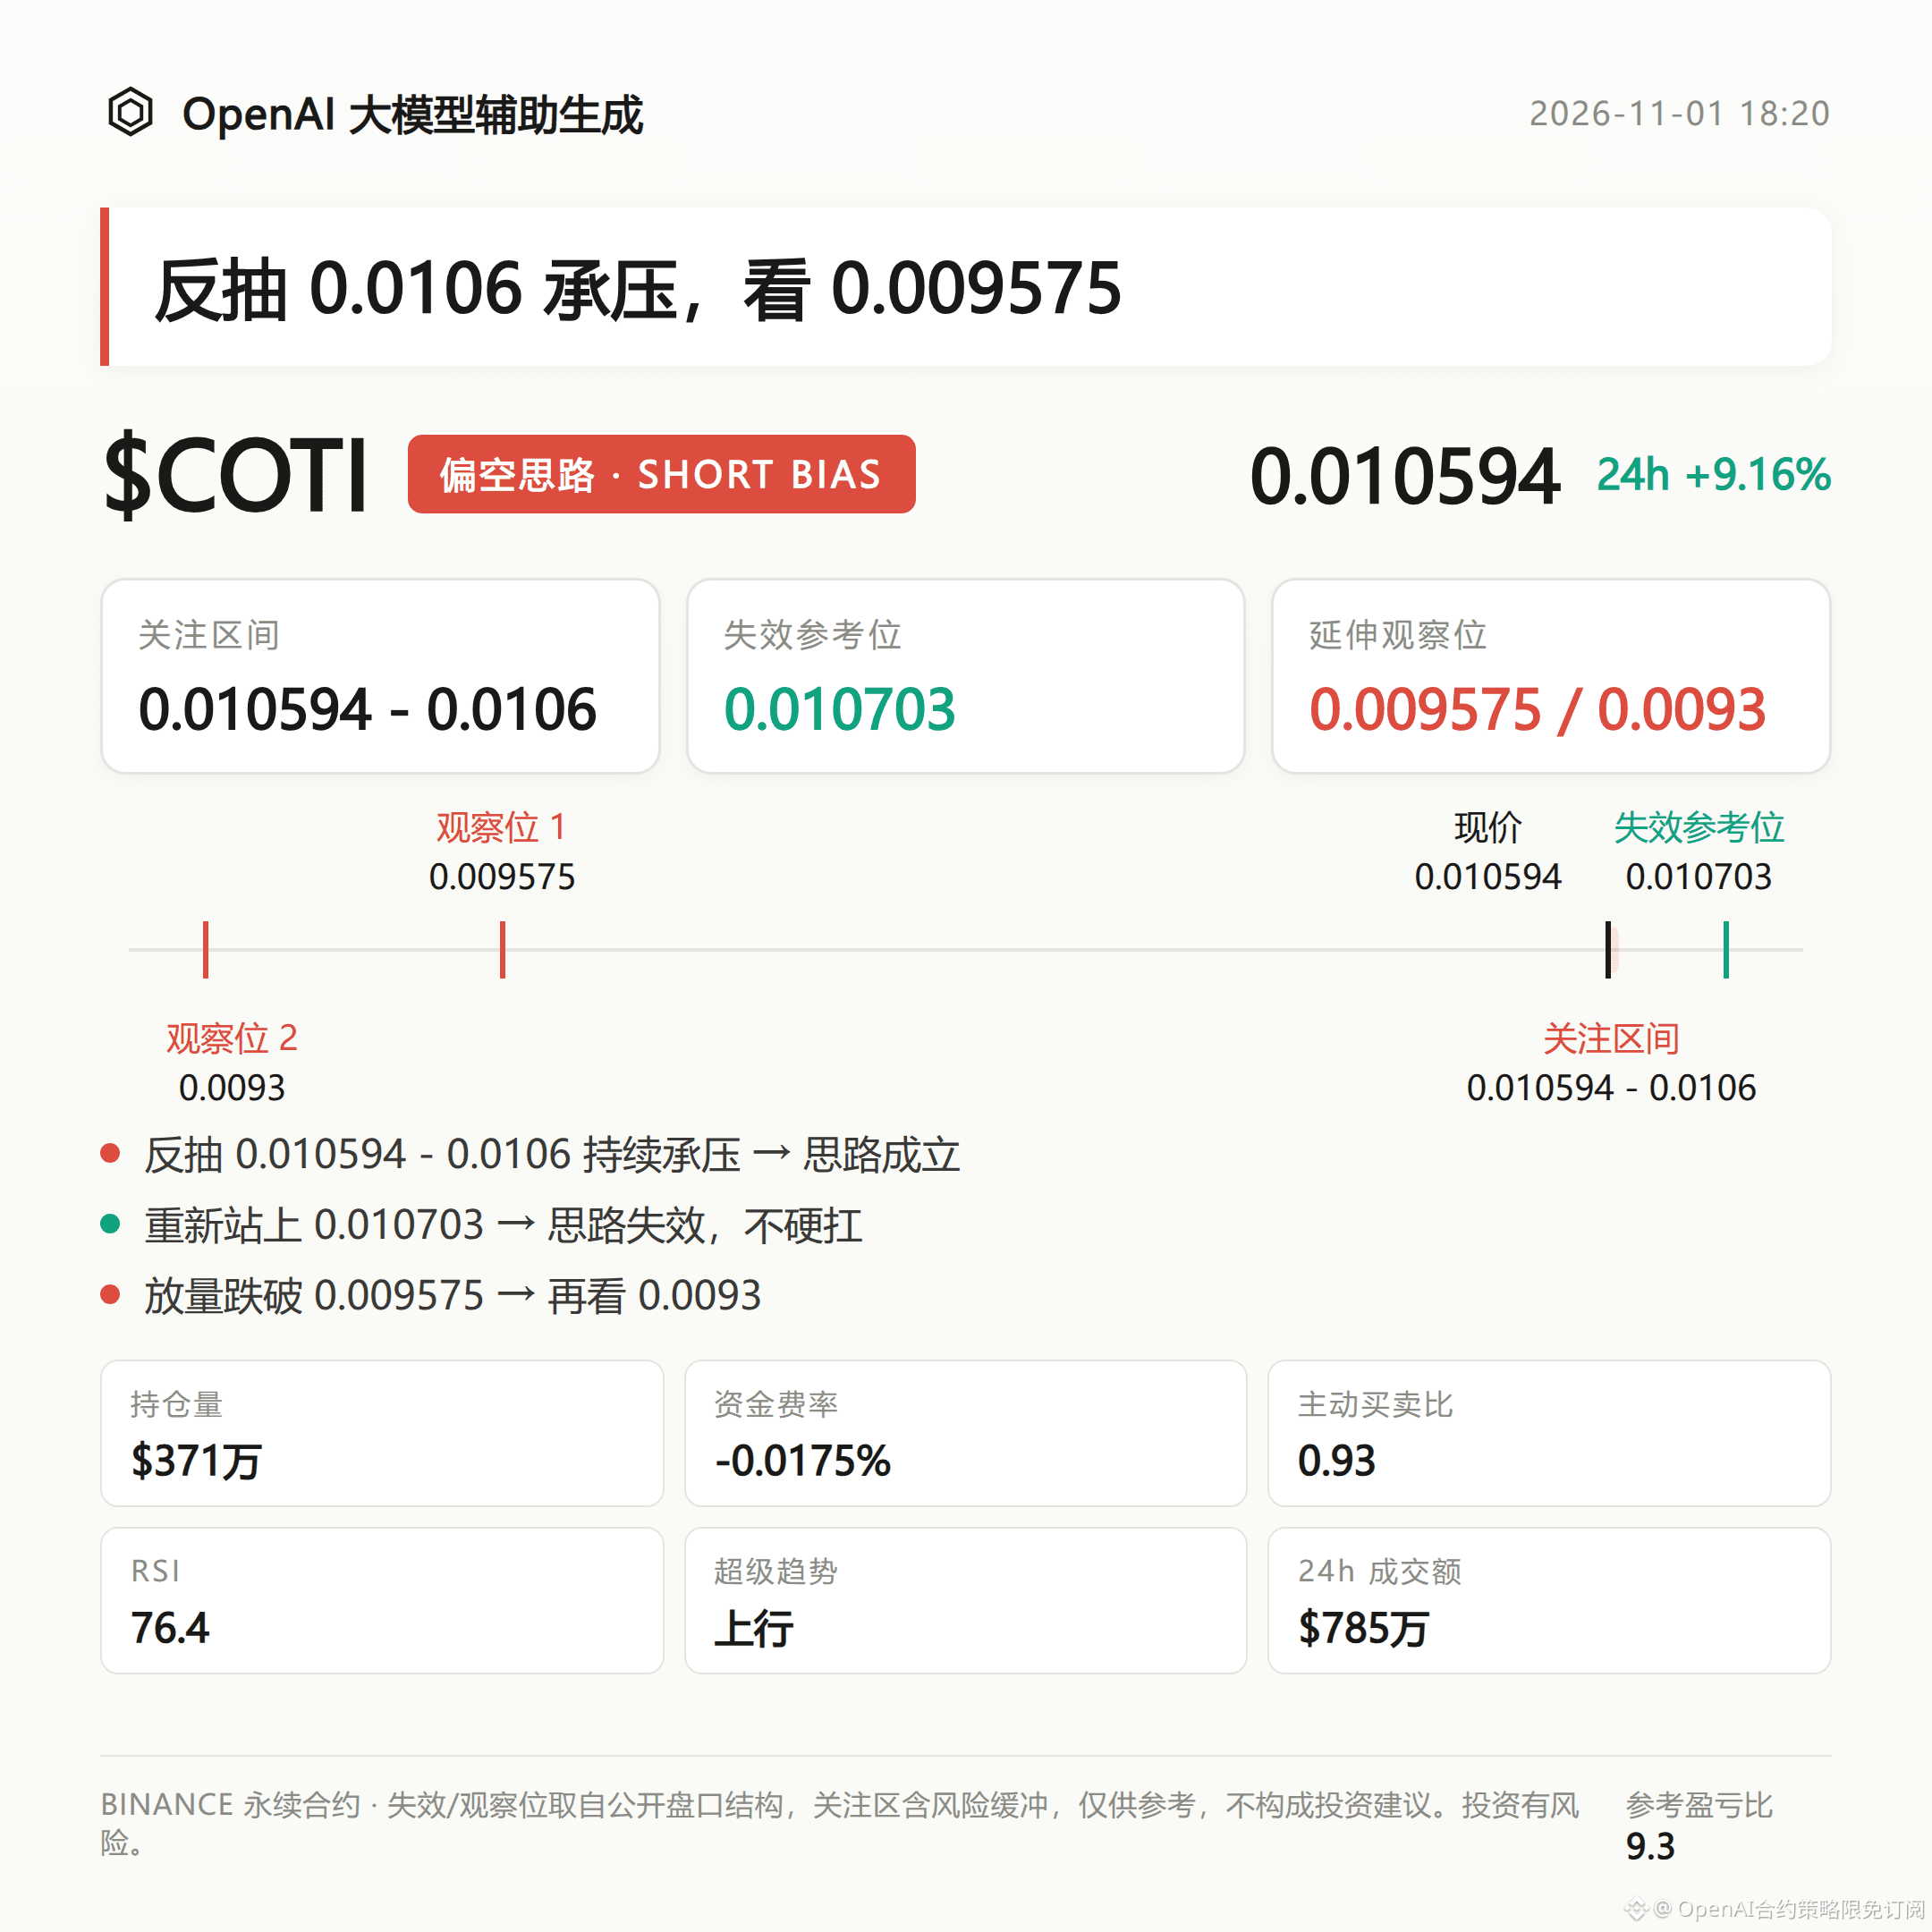
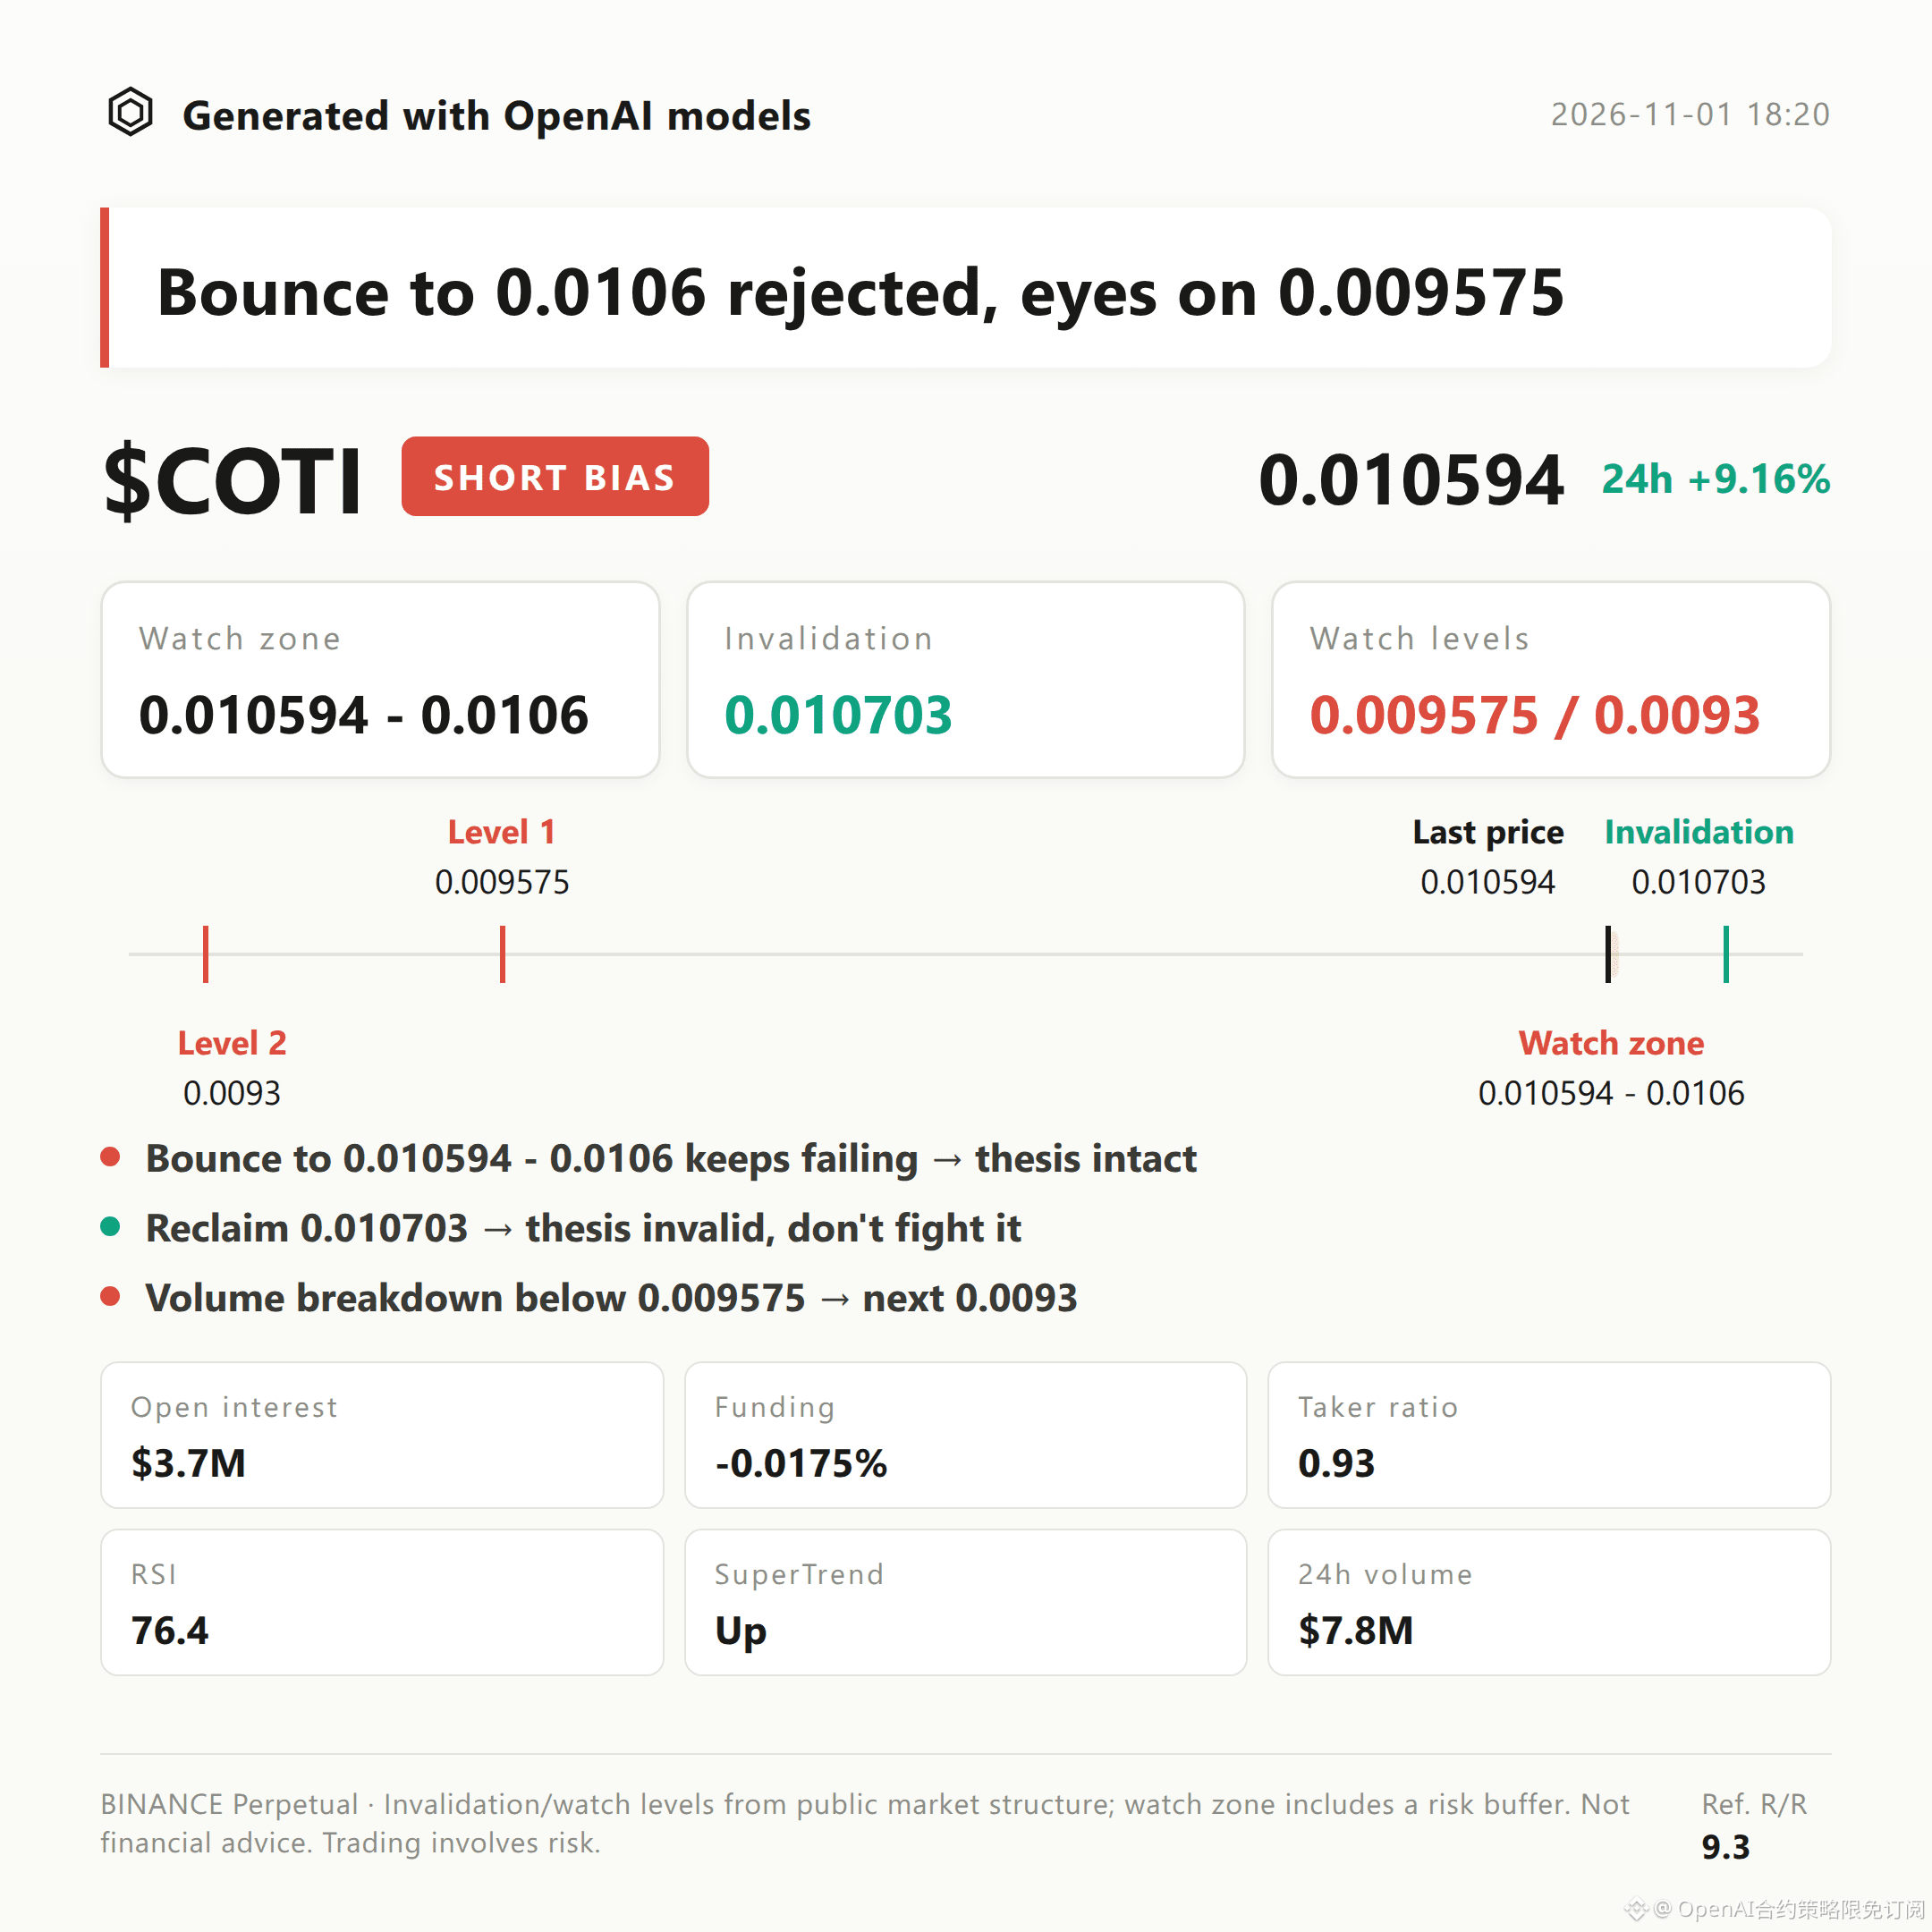
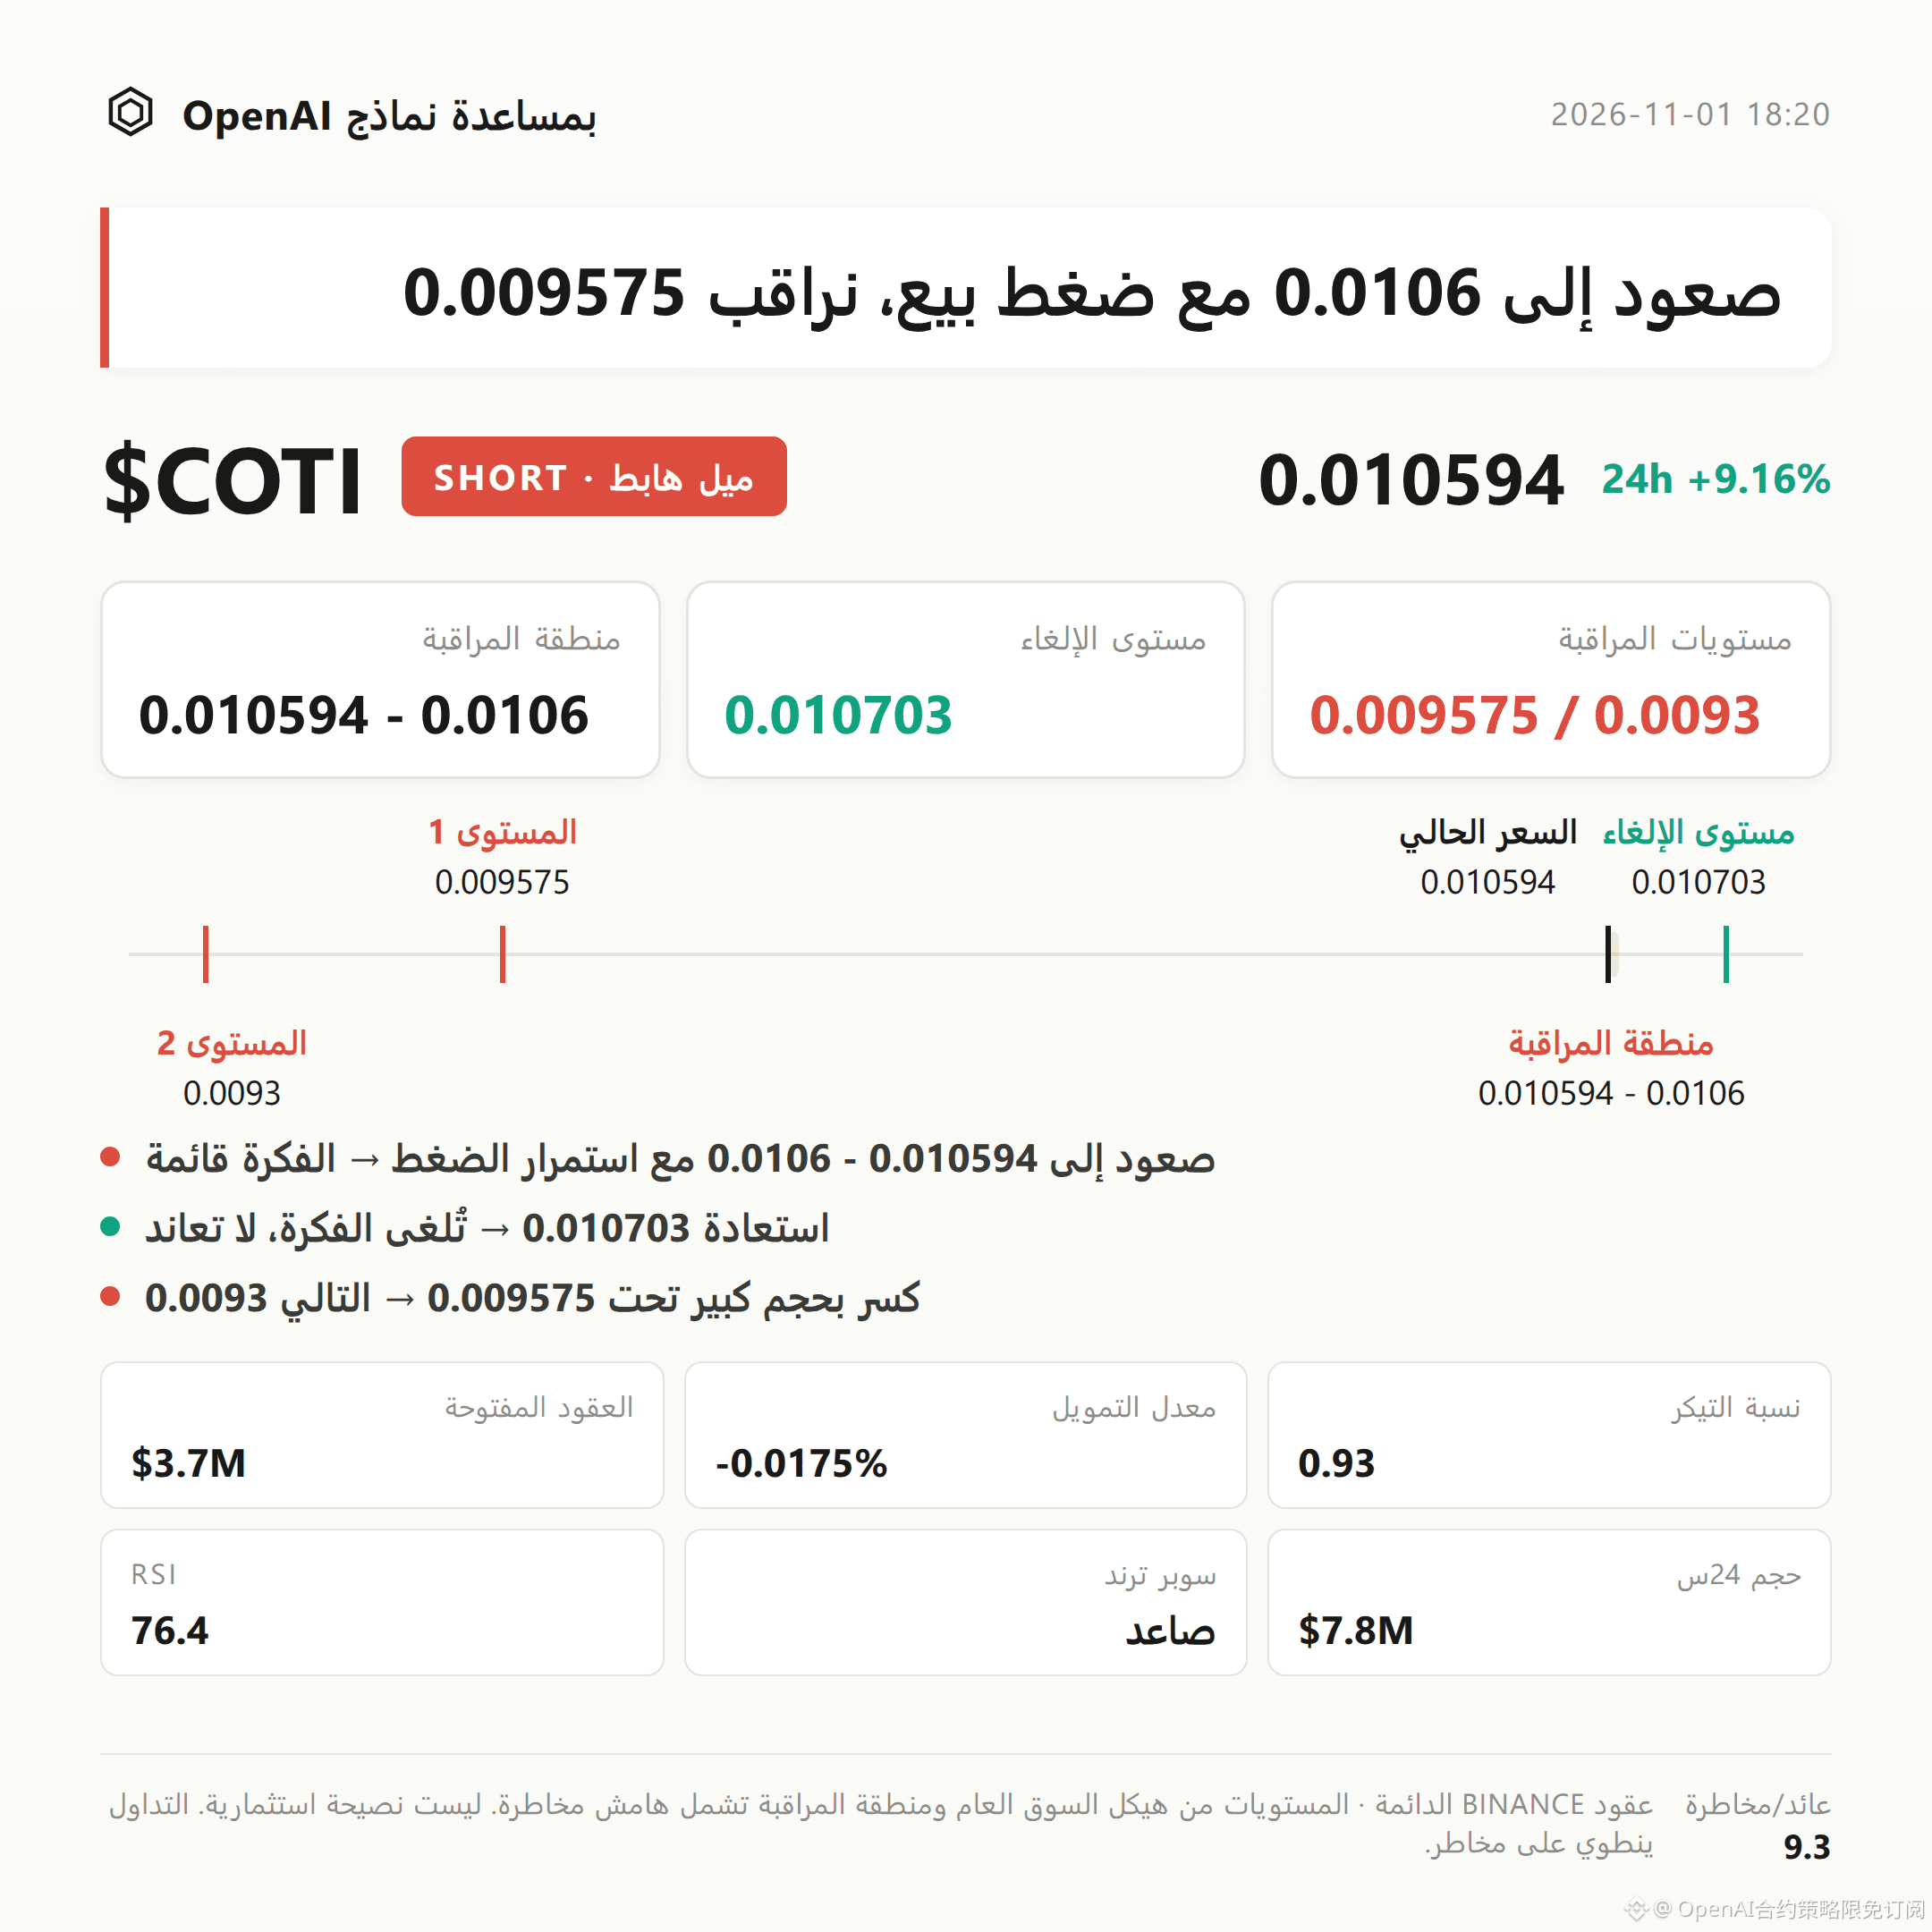
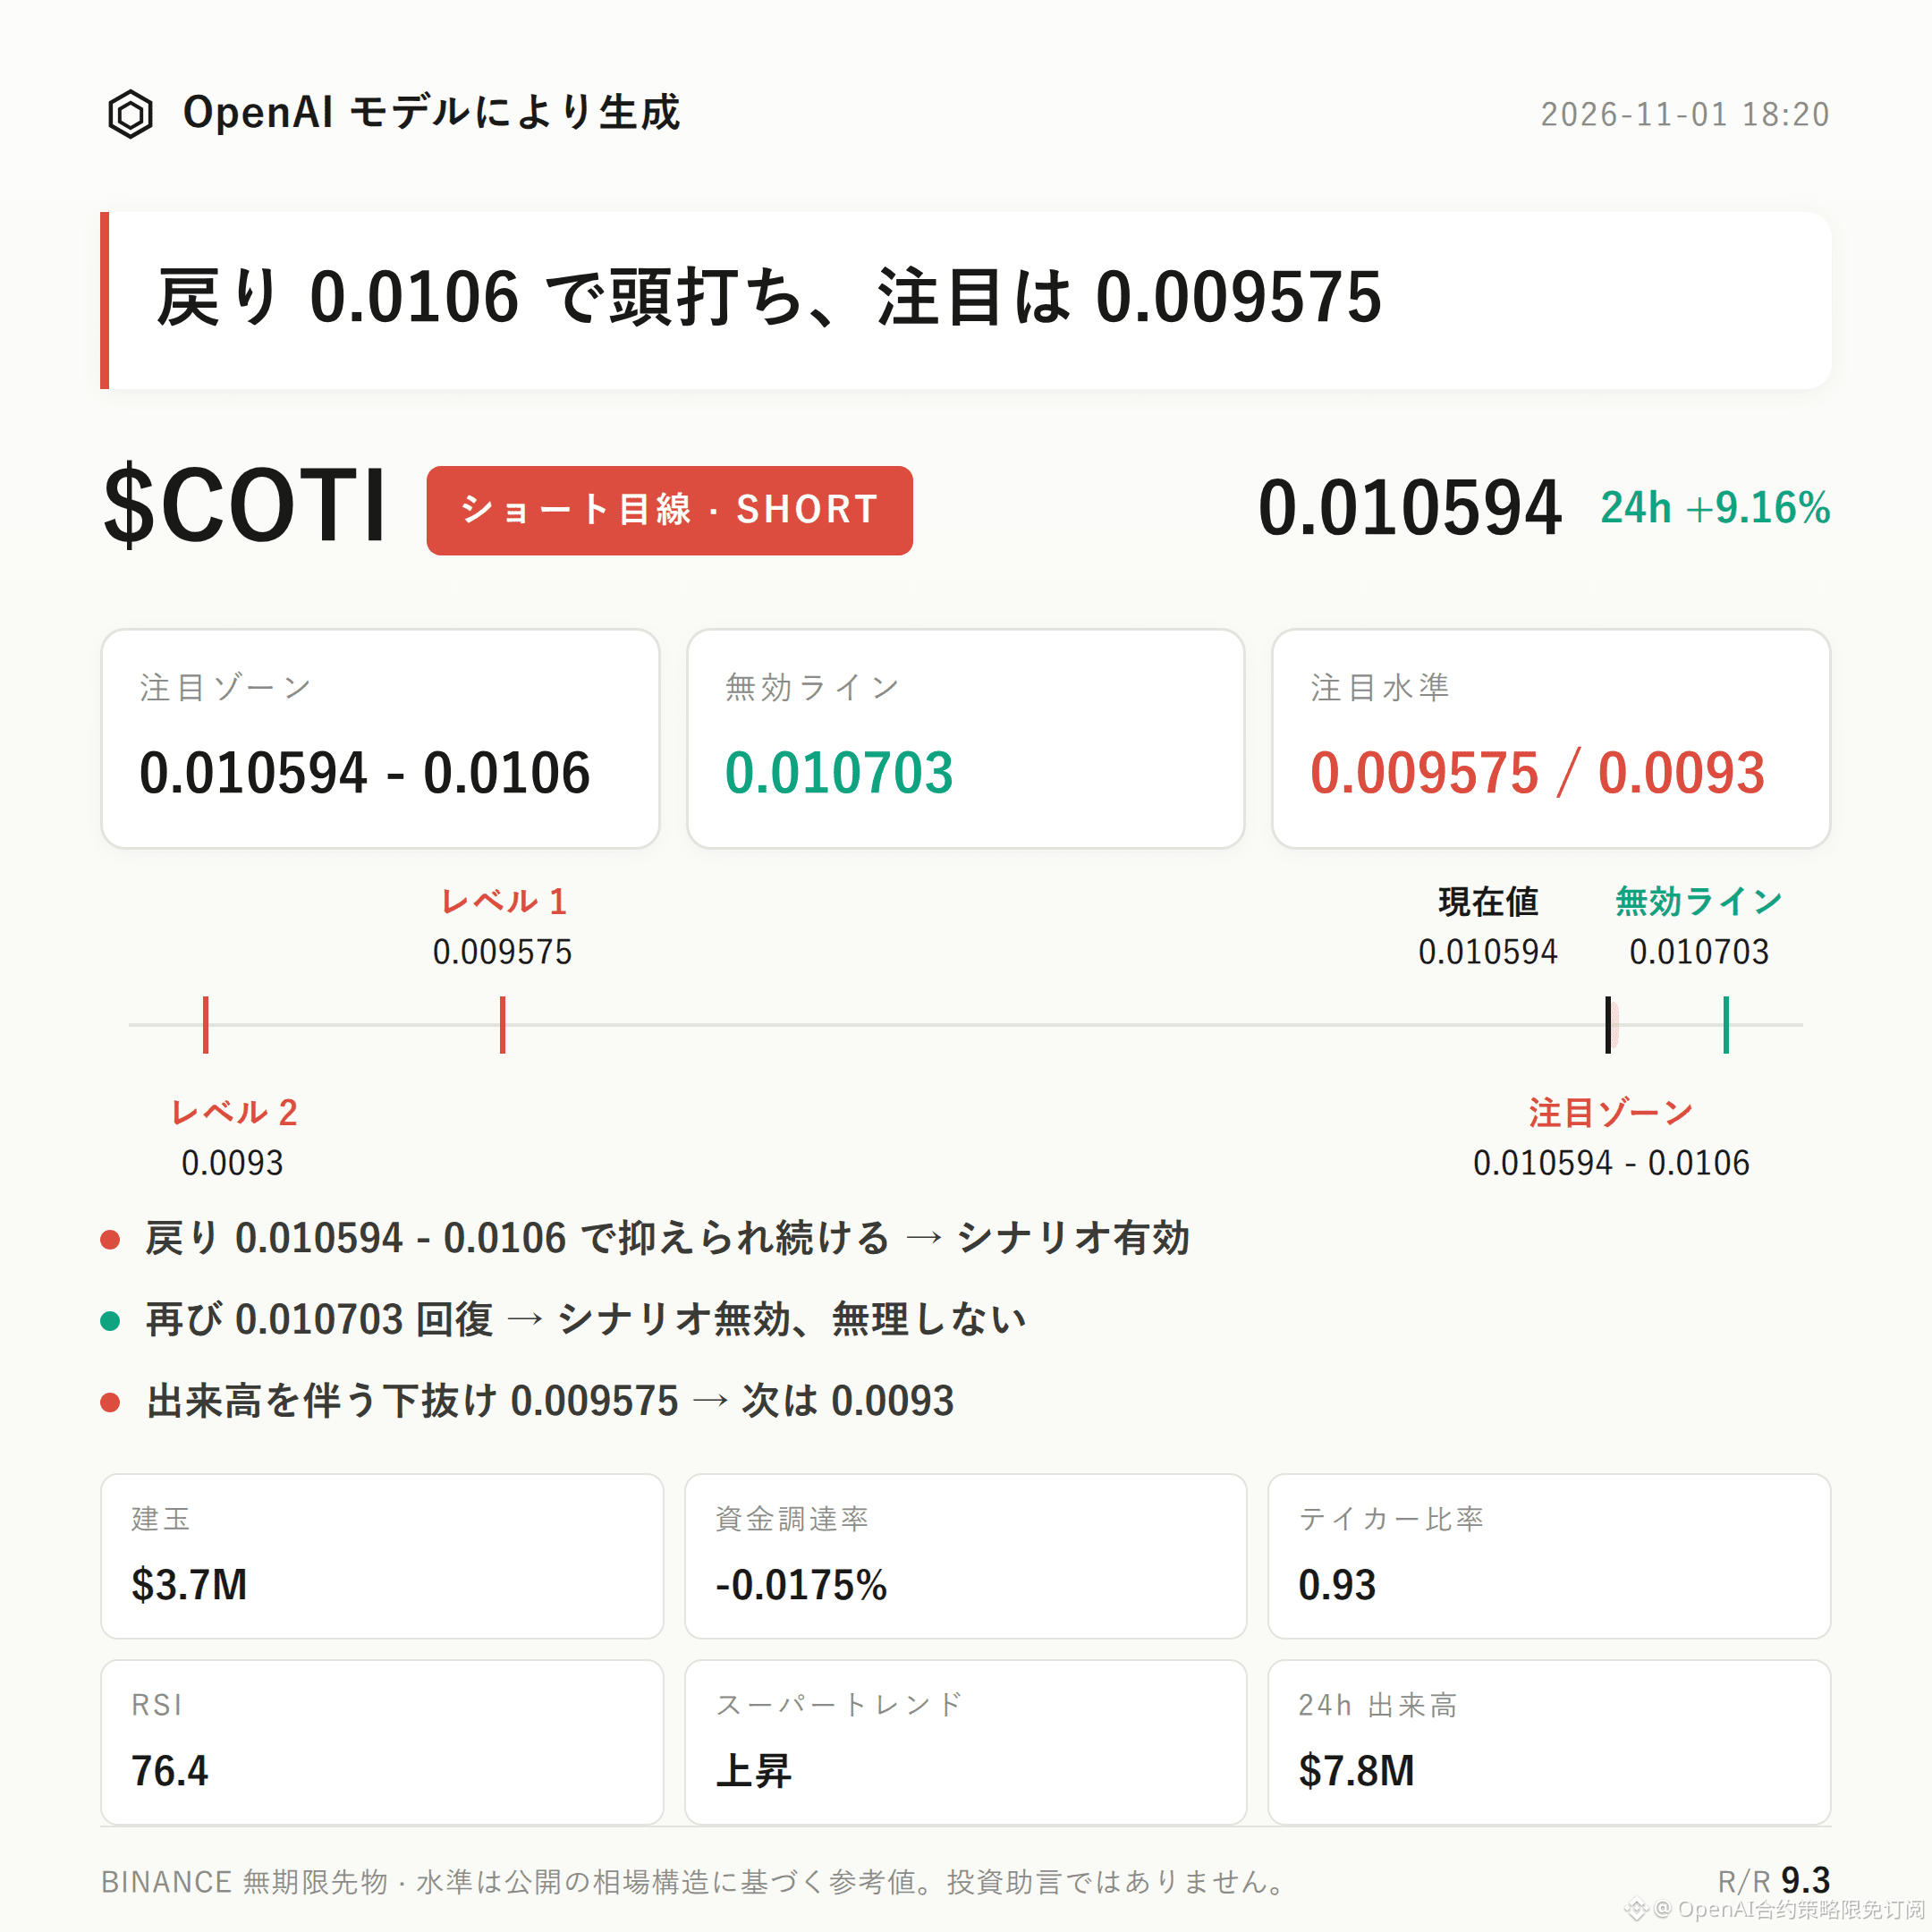
$COTI Bearish Outlook | Zone to Watch 0.010594 - 0.0106 | Invalidation Reference 0.010703 | Levels to Watch 0.009575 / 0.0093
$COTI is currently showing a bearish structure, but this is a pullback outlook following an overheated rally.
The taker buy/sell ratio is only 0.93, with taker selling prevailing. RSI has risen to 76.4, and the current price of 0.010594 is close to the upper Bollinger Band at 0.0106.
The key is to watch whether the price remains under pressure after returning to the resistance zone, with further confirmation from selling activity.
Technically, the recent high is 0.010703, while the Bollinger middle and lower bands are at 0.01 and 0.0093, respectively.
RSI is in overbought territory, supporting the case for a short-term pullback.
However, MACD still shows bullish momentum, and Supertrend remains upward, indicating that the bearish outlook has not yet been confirmed by trend indicators and should only be validated conditionally.
In derivatives, the price is up 9.16% over 24 hours, with trading volume at $7.85 million. Open interest has risen to $3.71 million, up 15.0% over 24 hours, showing that rising prices are accompanied by expanding leveraged positions.
Long accounts make up 58%, but the taker buy/sell ratio is 0.93, indicating a divergence between account positioning and actual aggressive trading.
The funding rate is -0.0175%. The current positioning is not uniformly one-sided, so beware of volatility in both directions amid high open interest.
For shorts, first watch the 0.010594 - 0.0106 zone. If the price returns to this zone, finds some buying support but fails to hold above it, and then comes under pressure, the bearish outlook is valid.
If the price moves back above the 0.010703 invalidation reference, that would indicate the current pullback structure has been broken and invalidate the bearish outlook. Do not overstay the trade.
If price breaks below the first level to watch at 0.009575 on increased volume, then watch for support around 0.0093. Do not project further downside before that level breaks.
Countervailing evidence includes bullish MACD momentum and an upward-trending Supertrend. There are no other significant opposing signals for now, but a continuation of the trend could still limit the pullback.
Leverage in futures is itself a risk; position discipline matters more than directional conviction.
For reference only; this does not constitute investment advice. Futures involve leverage, and investing carries risk.
This article was generated with the assistance of an OpenAI large language model.
$COTI #FuturesAnalysis
$COTI Bearish Outlook | Zone to Watch 0.010594 - 0.0106 | Invalidation Reference 0.010703 | Levels to Watch 0.009575 / 0.0093
$COTI is currently showing a bearish structure, but this is a pullback outlook following an overheated rally.
The taker buy/sell ratio is only 0.93, with taker selling prevailing. RSI has risen to 76.4, and the current price of 0.010594 is close to the upper Bollinger Band at 0.0106.
The key is to watch whether the price remains under pressure after returning to the resistance zone, with further confirmation from selling activity.
Technically, the recent high is 0.010703, while the Bollinger middle and lower bands are at 0.01 and 0.0093, respectively.
RSI is in overbought territory, supporting the case for a short-term pullback.
However, MACD still shows bullish momentum, and Supertrend remains upward, indicating that the bearish outlook has not yet been confirmed by trend indicators and should only be validated conditionally.
In derivatives, the price is up 9.16% over 24 hours, with trading volume at $7.85 million. Open interest has risen to $3.71 million, up 15.0% over 24 hours, showing that rising prices are accompanied by expanding leveraged positions.
Long accounts make up 58%, but the taker buy/sell ratio is 0.93, indicating a divergence between account positioning and actual aggressive trading.
The funding rate is -0.0175%. The current positioning is not uniformly one-sided, so beware of volatility in both directions amid high open interest.
For shorts, first watch the 0.010594 - 0.0106 zone. If the price returns to this zone, finds some buying support but fails to hold above it, and then comes under pressure, the bearish outlook is valid.
If the price moves back above the 0.010703 invalidation reference, that would indicate the current pullback structure has been broken and invalidate the bearish outlook. Do not overstay the trade.
If price breaks below the first level to watch at 0.009575 on increased volume, then watch for support around 0.0093. Do not project further downside before that level breaks.
Countervailing evidence includes bullish MACD momentum and an upward-trending Supertrend. There are no other significant opposing signals for now, but a continuation of the trend could still limit the pullback.
Leverage in futures is itself a risk; position discipline matters more than directional conviction.
For reference only; this does not constitute investment advice. Futures involve leverage, and investing carries risk.
This article was generated with the assistance of an OpenAI large language model.
$COTI #FuturesAnalysis