📊 A look at XRP’s monthly returns: What do the historical figures tell us?
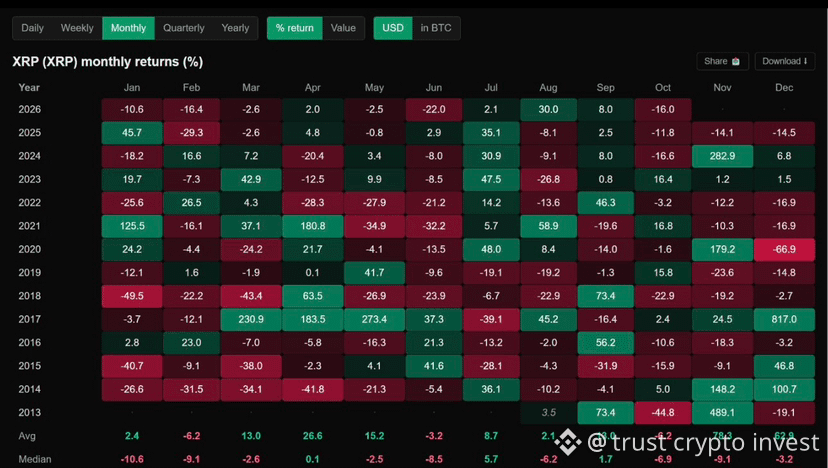
Let’s take a quick, detailed look at the monthly returns table for $XRP from 2013 through 2026!
The colors reveal exciting stories and market swings. Here are the key takeaways and insights from the table:
2026 (year to date): The table shows several months of returns. The year began with declines in January (-10.8%), February (-16.4%), and March (-2.6%), followed by a slight improvement in April (2.0%). It then fell again in May (-2.5%) and June (-22.0%), before making a notable recovery in July (2.1%), August (30.0%), and September (8.0%), and then posting another decline in October (-16.0%).
• Notable historical surges:
In 2021, April saw an exceptional jump of +180.8%, while January gained +125.5%.
In 2017, the figures were phenomenal, particularly in March (+230.9%), April (+183.5%), May (+273.4%), and December, which soared by a historic +817.0%.
Most active months on average (Avg): Average returns (Avg) show that months such as April (26.8%), November (76.3%), and December (63.9%) have historically tended to deliver strong positive performance compared with other months.
Based on this historical performance, what do you expect the market trend to be in the coming period? Do you think a green season is coming soon for XRP?
Share your thoughts in the comments! 👇💬
#Write2Earn
Let’s take a quick, detailed look at the monthly returns table for $XRP from 2013 through 2026!
The colors reveal exciting stories and market swings. Here are the key takeaways and insights from the table:
2026 (year to date): The table shows several months of returns. The year began with declines in January (-10.8%), February (-16.4%), and March (-2.6%), followed by a slight improvement in April (2.0%). It then fell again in May (-2.5%) and June (-22.0%), before making a notable recovery in July (2.1%), August (30.0%), and September (8.0%), and then posting another decline in October (-16.0%).
• Notable historical surges:
In 2021, April saw an exceptional jump of +180.8%, while January gained +125.5%.
In 2017, the figures were phenomenal, particularly in March (+230.9%), April (+183.5%), May (+273.4%), and December, which soared by a historic +817.0%.
Most active months on average (Avg): Average returns (Avg) show that months such as April (26.8%), November (76.3%), and December (63.9%) have historically tended to deliver strong positive performance compared with other months.
Based on this historical performance, what do you expect the market trend to be in the coming period? Do you think a green season is coming soon for XRP?
Share your thoughts in the comments! 👇💬
#Write2Earn