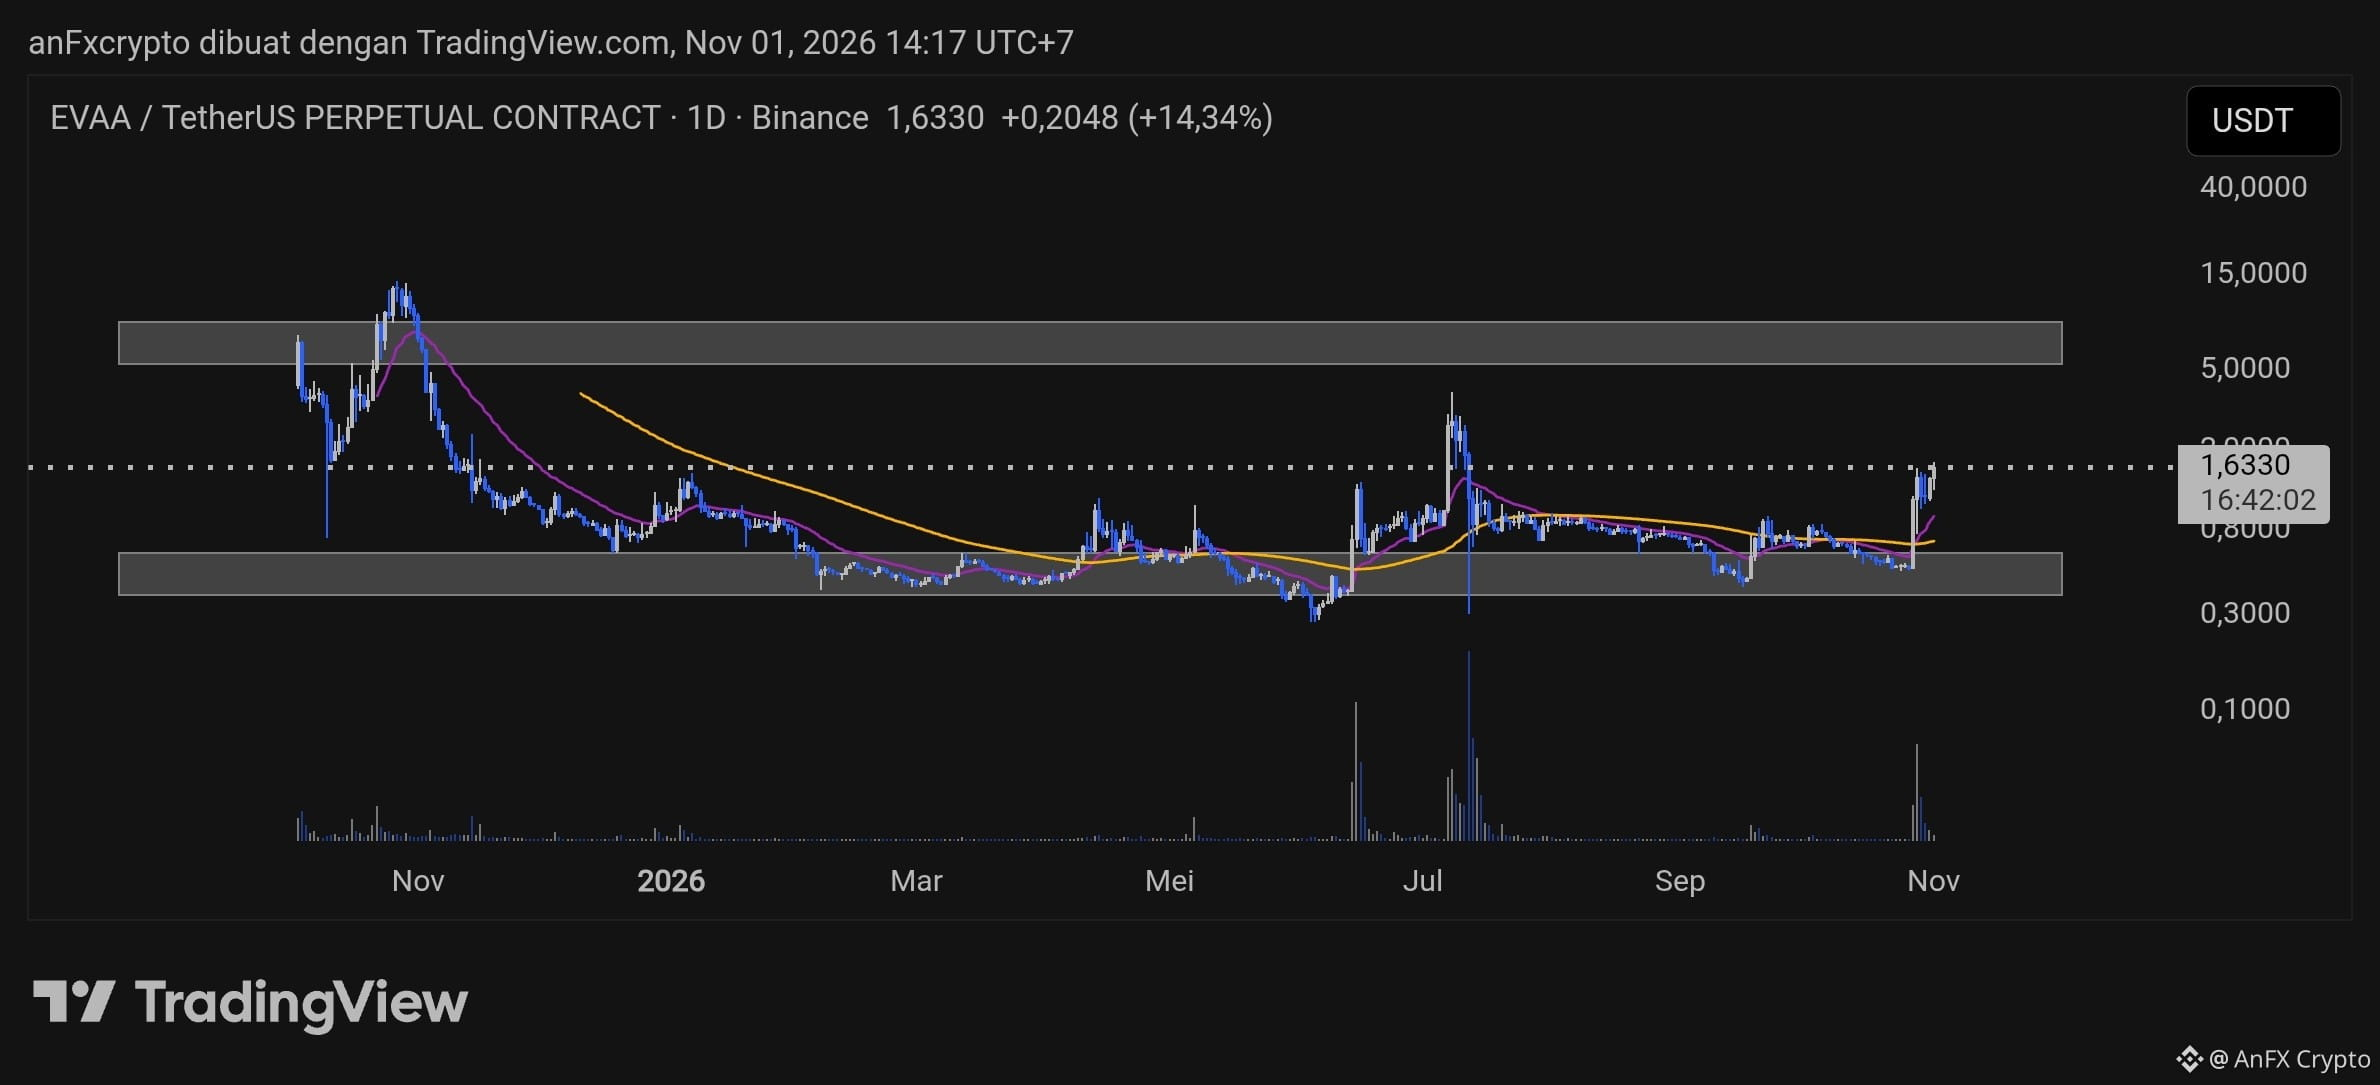
Technical Analysis $EVAA /USDT (1D):
Market Structure & Trend: The price broke through the lower end of the consolidation range with a significant surge in volume, recording a daily gain to around $1.6330. This indicates short-term bullish momentum following a lengthy accumulation phase near the bottom.
Key Zones:
Resistance: $2.00 and the upper boundary of the previous range.
Support: $1.10–$1.20 and the moving average area below.
Trading Signals:
Action: Buy on Pullback / Breakout Entry
Entry Price: $1.40–$1.60
Take Profit (TP): $2.00 / $2.50
Stop Loss (SL): $1.05 (below the nearest support area)
Risk Note: This asset is highly volatile; adjust your position size and always use risk management.
Market Structure & Trend: The price broke through the lower end of the consolidation range with a significant surge in volume, recording a daily gain to around $1.6330. This indicates short-term bullish momentum following a lengthy accumulation phase near the bottom.
Key Zones:
Resistance: $2.00 and the upper boundary of the previous range.
Support: $1.10–$1.20 and the moving average area below.
Trading Signals:
Action: Buy on Pullback / Breakout Entry
Entry Price: $1.40–$1.60
Take Profit (TP): $2.00 / $2.50
Stop Loss (SL): $1.05 (below the nearest support area)
Risk Note: This asset is highly volatile; adjust your position size and always use risk management.