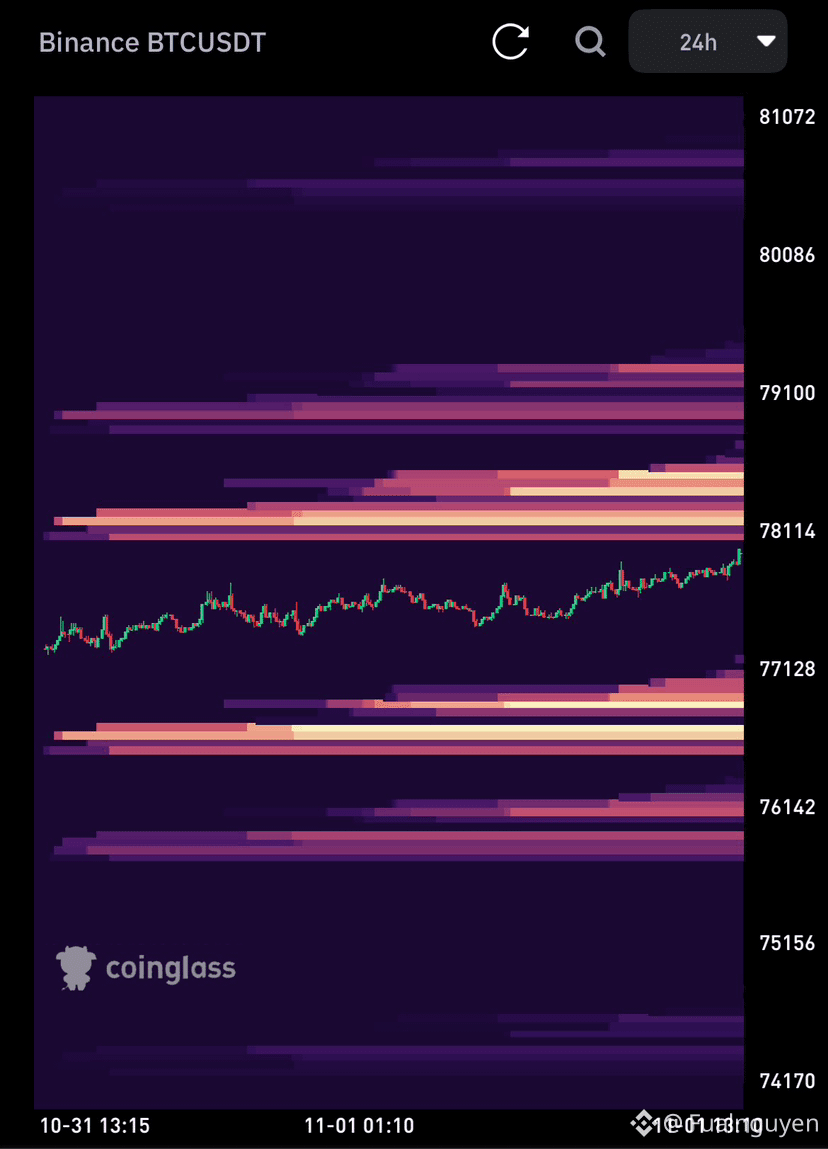
$BTC is approaching the liquidity cluster above — Shorts should take note, as a bounce could quickly turn profits into pressure to close positions.
The 24h heatmap shows estimated liquidity bands concentrated around $78,100–$78,500, fairly close to the price shown in the image, with the $79,000–$79,300 zone farther up.
If Binance conditions stabilize and market sentiment improves, BTC breaking above recent highs could trigger buying to close Shorts, fueling a move higher to test these clusters.
However, bright liquidity does not guarantee it will be “swept,” and significant clusters remain below — wait for price confirmation, and don’t chase a Long just because you expect a short squeeze.
Will the Shorts proactively protect their profits, or wait until their liquidation orders become fuel for the next move up?
The 24h heatmap shows estimated liquidity bands concentrated around $78,100–$78,500, fairly close to the price shown in the image, with the $79,000–$79,300 zone farther up.
If Binance conditions stabilize and market sentiment improves, BTC breaking above recent highs could trigger buying to close Shorts, fueling a move higher to test these clusters.
However, bright liquidity does not guarantee it will be “swept,” and significant clusters remain below — wait for price confirmation, and don’t chase a Long just because you expect a short squeeze.
Will the Shorts proactively protect their profits, or wait until their liquidation orders become fuel for the next move up?