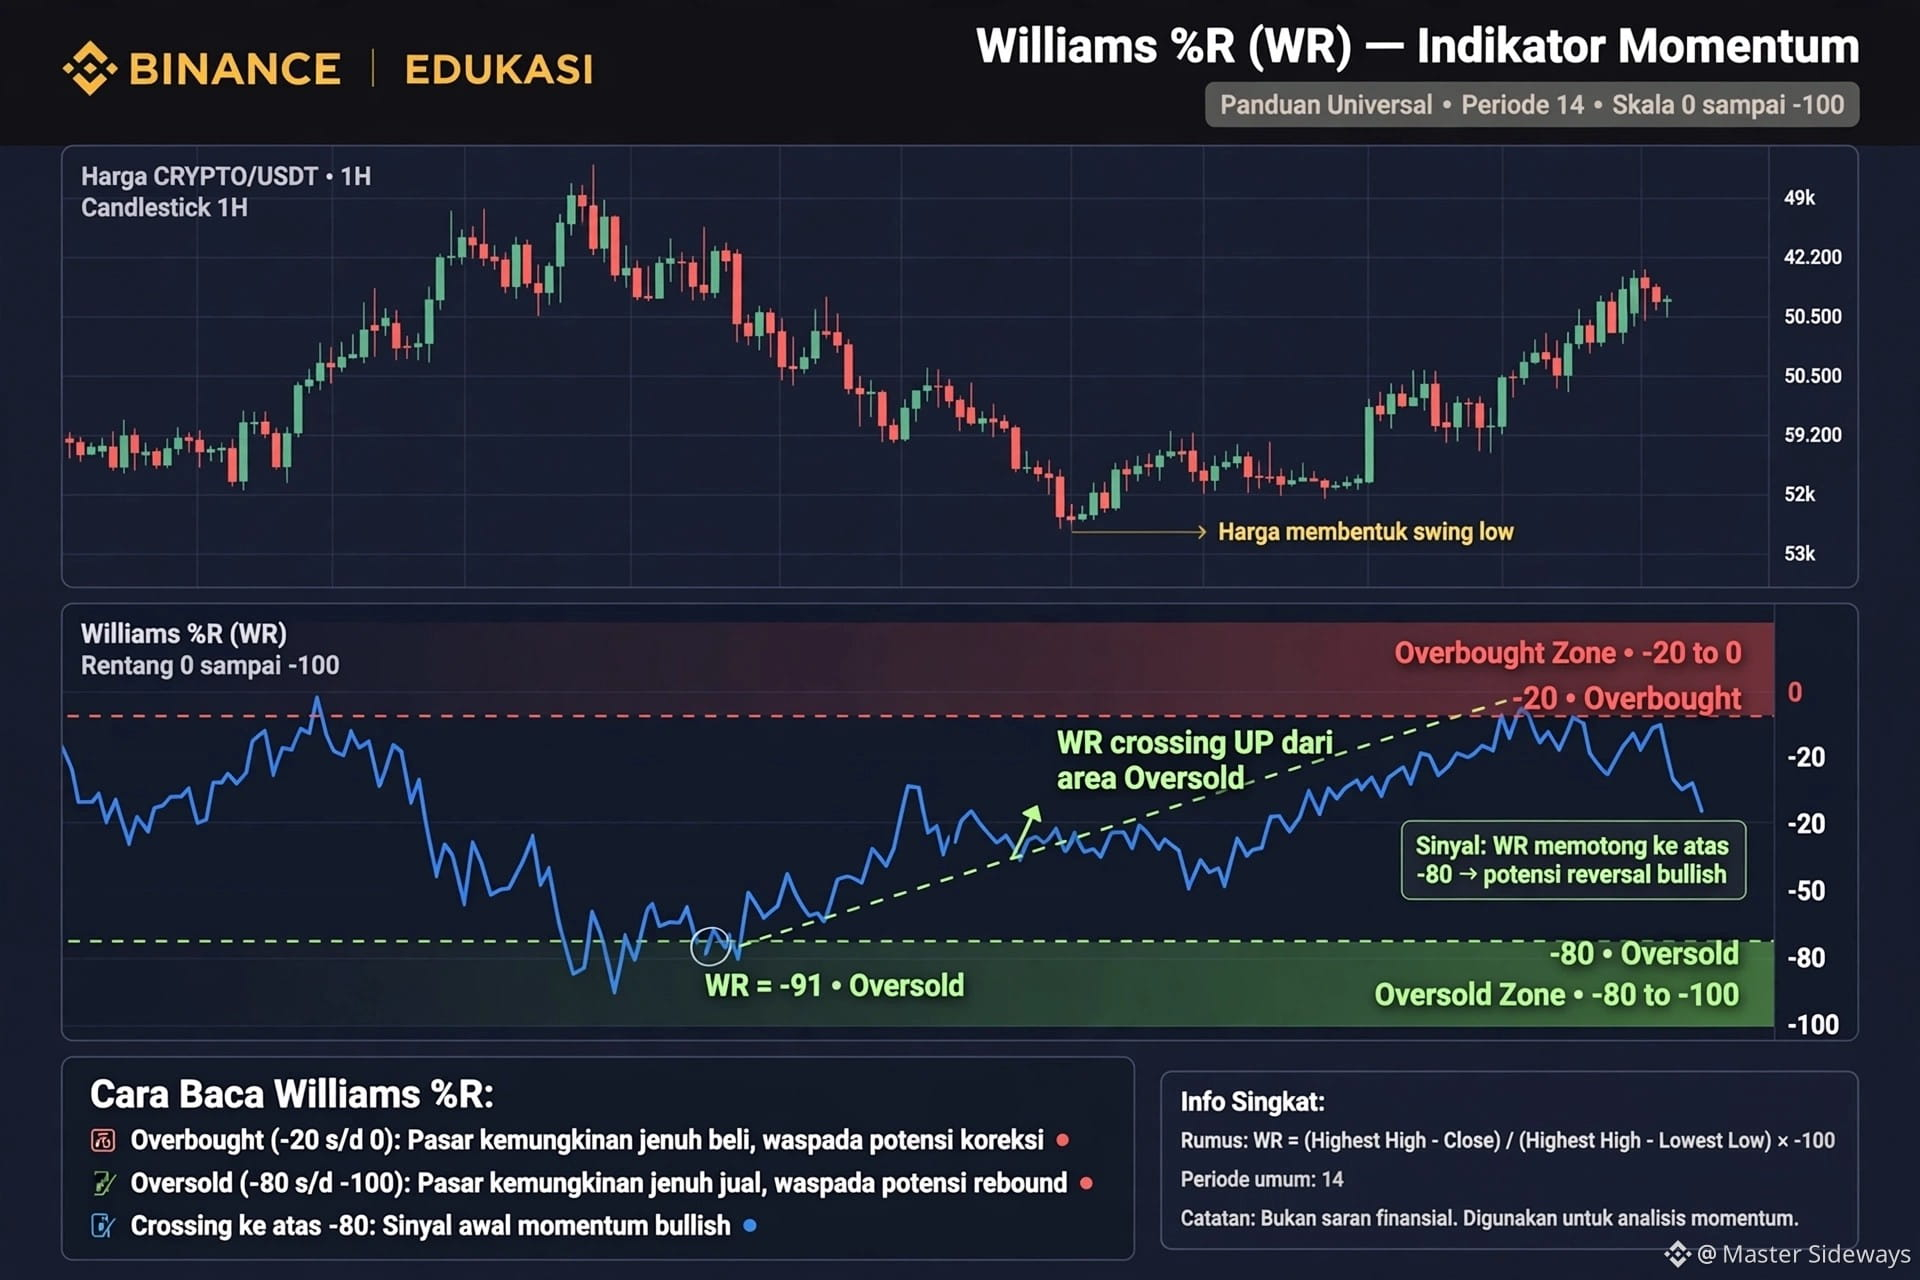
Williams %R: An Indicator for Spotting Cheap & Expensive Prices
Many people find Williams %R confusing because its values are negative. But it’s one of the simplest indicators for spotting when a coin is on sale.
1. WHAT IS WR?
Williams %R (WR) is a momentum indicator ranging from 0 to -100.
- 0 = Most Expensive Zone (Overbought)
- -100 = Cheapest Zone (Oversold)
The principle is like a rubber band: The further it’s pulled toward -100, the greater the potential for it to bounce back up.
2. HOW TO READ THE 2 KEY LEVELS (Setting: 14)
- Levels -20 to 0 = OVERBOUGHT
The market is overbought, prices are already high, and a downward correction may follow. This is not a buying zone.
- Levels -80 to -100 = OVERSOLD
The market is oversold, prices are already low, and a rebound may follow. This is a zone to start paying attention to.
Simple rule: Watch at -80, be cautious at -20.
3. 3 WAYS TO USE WR CORRECTLY
A. Wait for a Cross, Don’t Enter Right Away
WR reaching -90 doesn’t mean you should buy immediately. Wait for WR to rise back above -80. This confirms that selling pressure has eased.
B. Look for Divergence (The Strongest Signal)
- Bullish Divergence: Price falls to a new low, but WR makes a higher low. This means sellers are weakening, with a potential upward reversal.
- Bearish Divergence: Price rises to a new high, but WR makes a lower high. This means buyers are weakening, with a potential downward reversal.
C. Don’t Use It on Its Own
WR is very sensitive and often gives false signals. Always combine it with RSI or MA.
Example of a reliable filter: WR below -80 + RSI below 30 = Valid Oversold Signal.
4. BEST SETTINGS ON BINANCE
Open Binance Chart > Indicators > Search for "Williams %R"
- Length: 14 (Standard)
- Timeframe: 1D for swing trading, 4H for day trading
- Levels: -20 and -80
Common Mistake: Using WR on 1M–5M timeframes. The result is noise and overtrading. WR is most accurate on 1H and above.
WR isn’t for guessing tops and bottoms, but to help you avoid buying at the top and selling at the bottom. Follow for educational content and daily signal analysis
Many people find Williams %R confusing because its values are negative. But it’s one of the simplest indicators for spotting when a coin is on sale.
1. WHAT IS WR?
Williams %R (WR) is a momentum indicator ranging from 0 to -100.
- 0 = Most Expensive Zone (Overbought)
- -100 = Cheapest Zone (Oversold)
The principle is like a rubber band: The further it’s pulled toward -100, the greater the potential for it to bounce back up.
2. HOW TO READ THE 2 KEY LEVELS (Setting: 14)
- Levels -20 to 0 = OVERBOUGHT
The market is overbought, prices are already high, and a downward correction may follow. This is not a buying zone.
- Levels -80 to -100 = OVERSOLD
The market is oversold, prices are already low, and a rebound may follow. This is a zone to start paying attention to.
Simple rule: Watch at -80, be cautious at -20.
3. 3 WAYS TO USE WR CORRECTLY
A. Wait for a Cross, Don’t Enter Right Away
WR reaching -90 doesn’t mean you should buy immediately. Wait for WR to rise back above -80. This confirms that selling pressure has eased.
B. Look for Divergence (The Strongest Signal)
- Bullish Divergence: Price falls to a new low, but WR makes a higher low. This means sellers are weakening, with a potential upward reversal.
- Bearish Divergence: Price rises to a new high, but WR makes a lower high. This means buyers are weakening, with a potential downward reversal.
C. Don’t Use It on Its Own
WR is very sensitive and often gives false signals. Always combine it with RSI or MA.
Example of a reliable filter: WR below -80 + RSI below 30 = Valid Oversold Signal.
4. BEST SETTINGS ON BINANCE
Open Binance Chart > Indicators > Search for "Williams %R"
- Length: 14 (Standard)
- Timeframe: 1D for swing trading, 4H for day trading
- Levels: -20 and -80
Common Mistake: Using WR on 1M–5M timeframes. The result is noise and overtrading. WR is most accurate on 1H and above.
WR isn’t for guessing tops and bottoms, but to help you avoid buying at the top and selling at the bottom. Follow for educational content and daily signal analysis