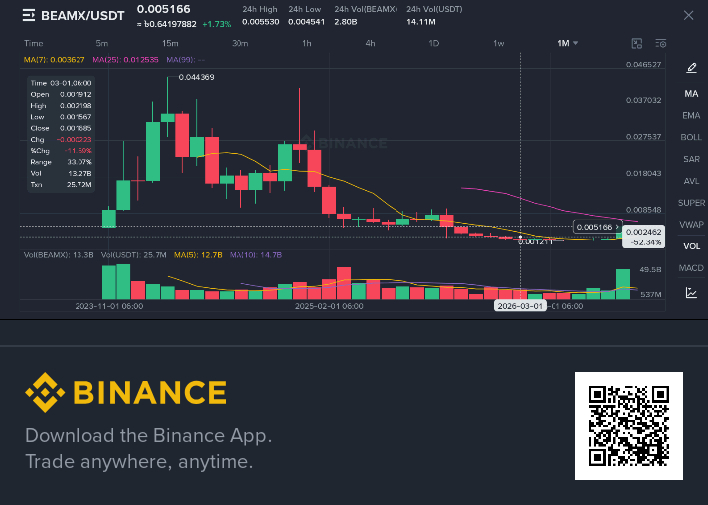

Trading pair and time frame
This is an analysis summary of the BEAMX/USDT spot 4-hour chart. A total of 30 candles were returned, of which 29 completed candles were used. The final candle is not yet complete, so it was excluded from the trend, range, momentum, and volume analysis.
Observable direction
Among the 29 completed 4-hour candles, the first candle opened at 0.003252 USDT, and the last completed candle closed at 0.005010 USDT.
Change: +0.001758 USDT
Percentage change: approximately +54.06%
Therefore, the overall direction during this 4-hour observation period was upward.
However, looking only at the last 5 completed candlesticks, the first opened at 0.005067 USDT and the last closed at 0.005010 USDT, a change of approximately -1.13% over the period. This indicates that after a substantial rise, the price is fluctuating around 0.005 USDT rather than continuing to move steadily upward.
Highs, lows, and price range
Across the 29 completed 4-hour candlesticks:
High: 0.005530 USDT
Low: 0.003206 USDT
Total price range: 0.002324 USDT
The last completed candlestick closed at 0.005010 USDT, approximately 77.6% above the low of the range and close to its high. In other words, over the full observation period, the price is in the upper part of the range, but it has pulled back somewhat after reaching 0.005530 USDT.
Momentum and trading volume
Comparing the first 5 and last 5 completed 4-hour candlesticks, recent volatility has expanded noticeably:
Average high-low range of the first 5 candlesticks: approximately 0.000103 USDT
Average high-low range of the last 5 candlesticks: approximately 0.000413 USDT
This means that the intraperiod price movement of a single recent candlestick has expanded to about 4 times its previous level. This indicates increased market participation, but also a significant rise in price volatility risk.
Trading volume has also risen substantially compared with earlier levels:
Average base asset trading volume of the first 5 candlesticks: approximately 116.1 million BEAMX
Average base asset trading volume of the last 5 candlesticks: approximately 437.6 million BEAMX
In terms of trading value in the quote asset:
Average trading value of the first 5 candlesticks: approximately 385,951 USDT
Average trading value of the last 5 candlesticks: approximately 2.224 million USDT
In other words, the average trading volume of the last 5 candlesticks increased by about 3.8 times, while the average trading value increased by about 5.8 times.
However, the trading volume of the most recent completed candlestick fell from 540.5 million BEAMX in the previous candlestick to 458.7 million BEAMX, while trading value fell from 2.762 million USDT to 2.358 million USDT. Therefore, although market momentum remains elevated, the most recent candlesticks show some signs of cooling, and prices have moved in both directions.
Caveats
This summary is based only on completed 4-hour candlesticks; the 1-hour or daily timeframes may show a different picture.
There are currently only 30 candlesticks, so the observation window is relatively short and is not sufficient to determine the long-term trend or a reasonable valuation.
The currently forming candlestick is not included in the analysis; its high, low, and closing prices have not yet been finalized.
Candlestick and trading volume data cannot guarantee the future direction of prices, nor should they be used alone as the basis for buy, sell, entry, or exit decisions.$BEAMX