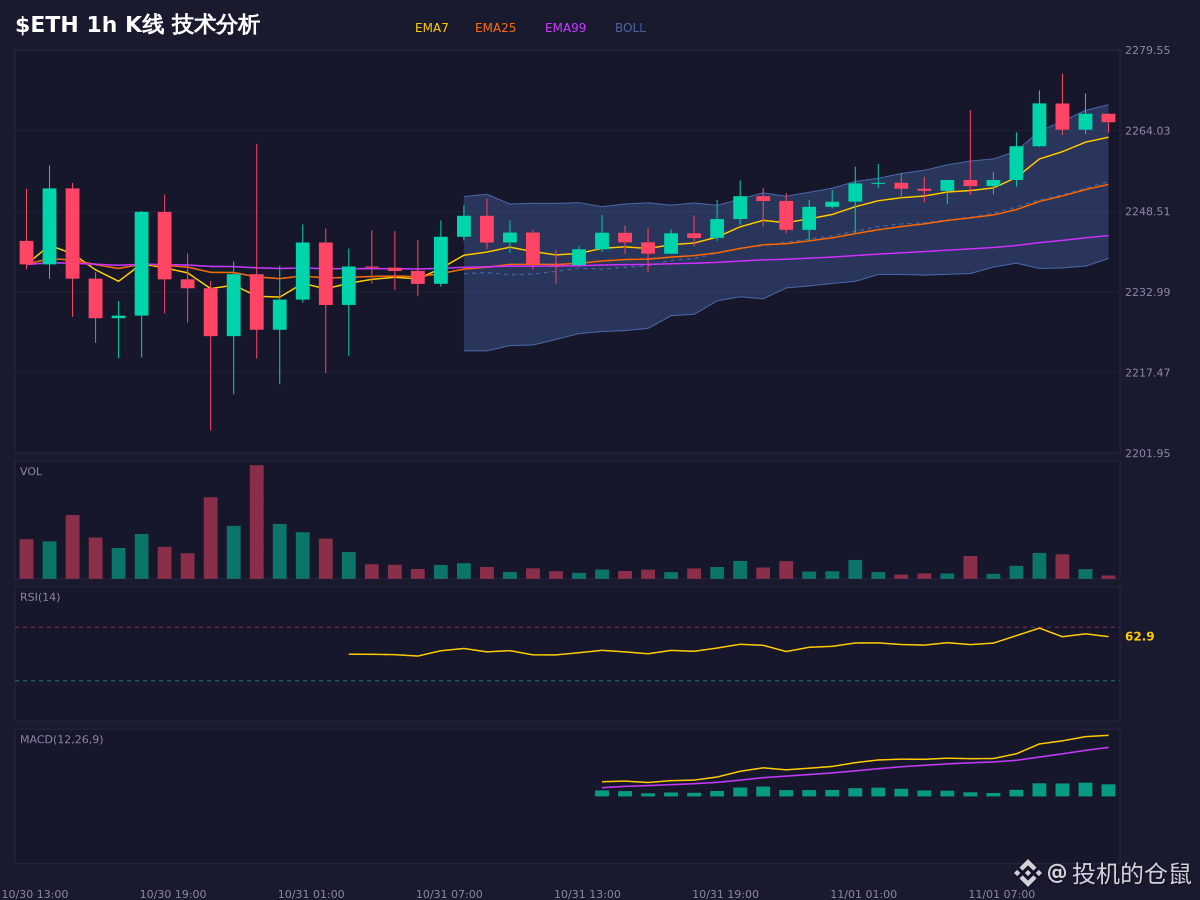
$ETH This move looks strong, but a closer look reveals quite a few risks.
The most glaring is the bearish divergence: the price has made a new high, but the RSI hasn't followed suit—a worrying sign. The 1-hour RSI is already at 63.6, nearing overbought territory, while the 4-hour RSI is only 48.4. That's a notable gap.
The MACD histogram is shrinking, and bullish momentum is starting to fade. Although the moving averages are still in a bullish alignment overall, chasing the price higher carries considerable risk.
If it holds above 2253.68 (EMA25), the bullish structure can continue; if it falls below 2245.51, the current thesis is invalidated.
For market observation and conditional scenario analysis only; this does not constitute a record of trading activity.
$ETH #牛市 #市场情绪 #Futures
The most glaring is the bearish divergence: the price has made a new high, but the RSI hasn't followed suit—a worrying sign. The 1-hour RSI is already at 63.6, nearing overbought territory, while the 4-hour RSI is only 48.4. That's a notable gap.
The MACD histogram is shrinking, and bullish momentum is starting to fade. Although the moving averages are still in a bullish alignment overall, chasing the price higher carries considerable risk.
If it holds above 2253.68 (EMA25), the bullish structure can continue; if it falls below 2245.51, the current thesis is invalidated.
For market observation and conditional scenario analysis only; this does not constitute a record of trading activity.
$ETH #牛市 #市场情绪 #Futures