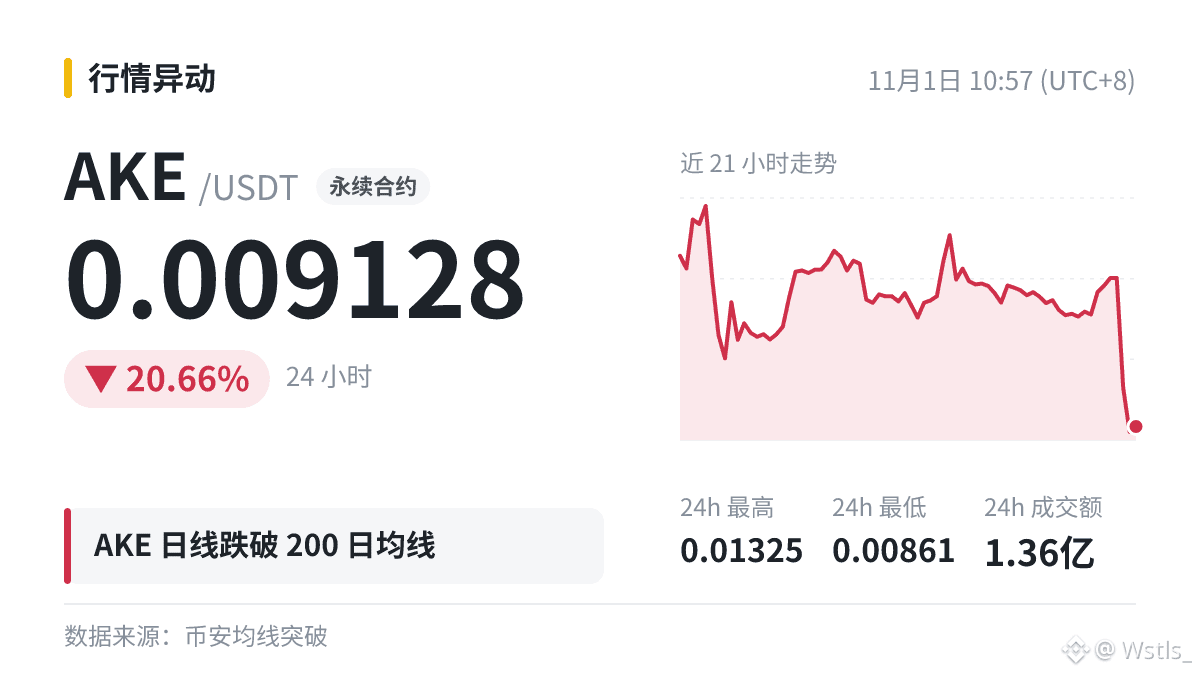
Technical Notes|$AKE |Daily chart breaks below MA200|MA200 0.009991
First, a definition: Long-term moving averages like the MA200 attract a lot of attention, partly because so many people are watching this line. When the price approaches it, volatility often becomes more pronounced.
How to read it: A moving average is simply an averaged line; it has no special power in itself. It often attracts attention because many people are watching it.
The same data can mean very different things under different market conditions, so don’t blindly apply a single rule.
#AKE