


Chart now
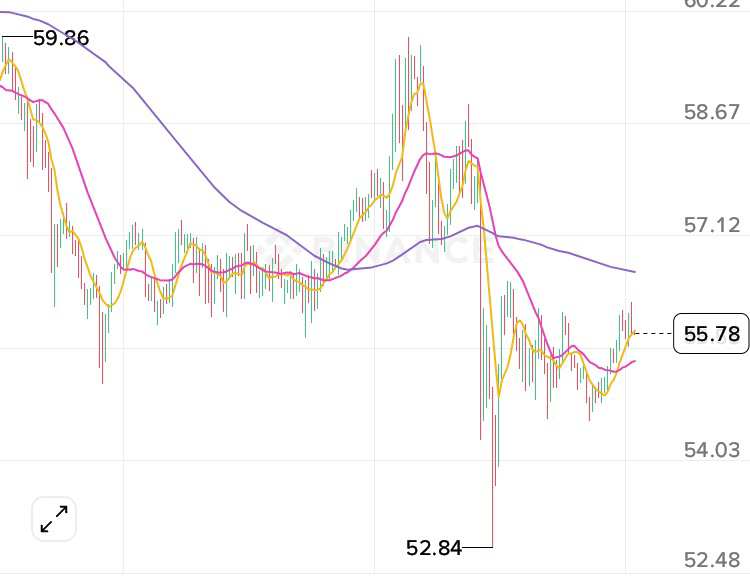
LTC Analysis - Oct 30, 2026
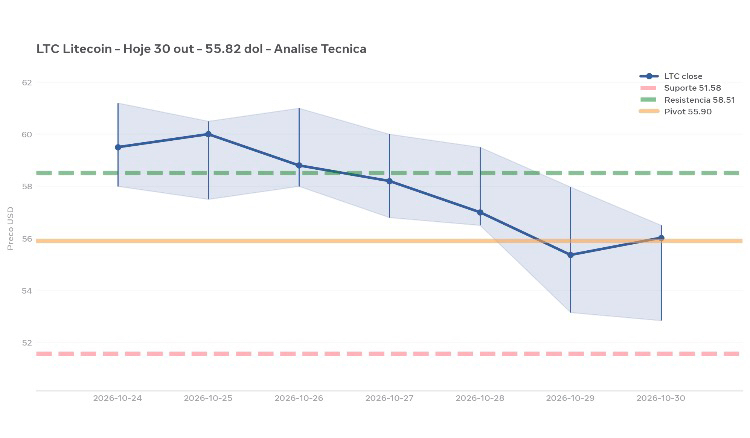
*Price now:* $55.82 (+1.43% 24h)
*Today's range:* $52.84 low / $58.93 high / now $56.02
*Week:* -6.64% / -7.94% this month
*Market cap:* $4.34B
*Key technicals:*
- Right at the *$55.90 pivot* — the line separating short-term bulls and bears
- Below all short-term averages: 7d MA $56.85, 20d MA $59.10, 50d MA $61.63; EMAs 12 and 26 are also above
- But *still above the MA at $52.19* — the long-term structure hasn't broken down
- Daily RSI 39.37, Stoch %K 32.46 — nearing oversold territory, %K crossed upward
- Bollinger %B at 0.15 — hugging the lower band ($54.51)
- *Open interest in futures rose 11.36% to $71.15M* today while price fell — people betting on both sides, volatility incoming
*Support and resistance:*
Support 1: $54.31 (today's low)
Strong support: *$51.58* and then $45.97
Resistance: *$58.51* and $59.64 (20-day MA)
*Fundamentals weighing on it:*
Same reason as every month: weak flows into U.S. spot Litecoin ETFs, with just $13–17M in assets, and Grayscale trying to convert its Litecoin Trust into an ETF but stuck in regulatory limbo. Without inflows, LTC can't keep up with BTC.
> LTC hit $52.84 and bounced back to $56 — did it hold?
> It fell 6.64% this week and is below all short-term moving averages, but held the MA at $52.19 and open interest rose 11% today.
> $55.90 is the key battleground right now. If it loses $51.58, that opens the door to $45.
> Are you seeing a bottom or more downside?
> $LTC #Litecoin
