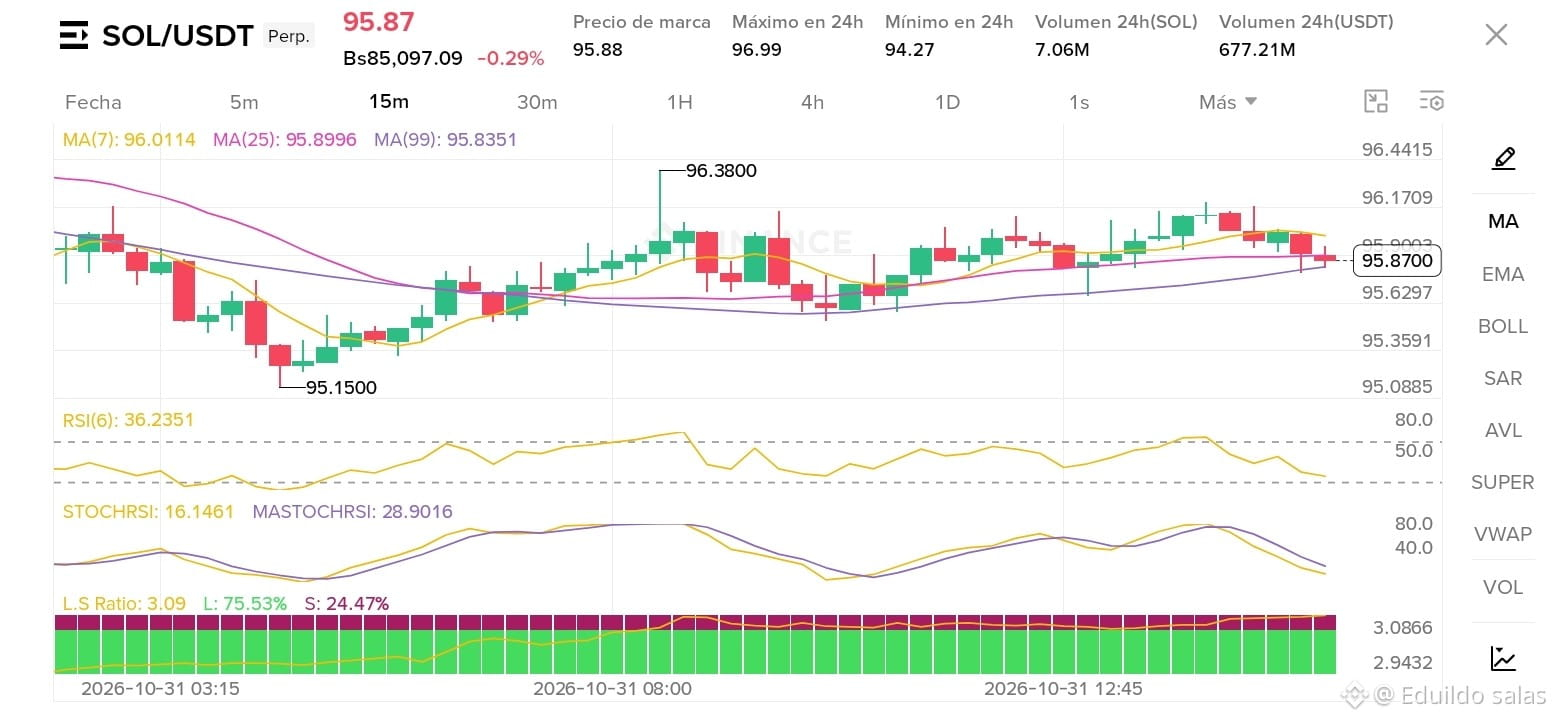
🚨 Real-Time Technical Analysis: $SOL /USDT (Short-Term Chart)📣
The $SOL pair is currently trading at 95.87 USDT (-0.29%), showing interesting dynamics after testing key support at 95.1500 USDT and seeking a technical rebound in the area. Are we seeing a consolidation phase ready for a new push, or is it time to remain cautious? Let's break it down:
Price Action and Support Levels: Following a previous downward correction that found an exact floor at 95.15 USDT, the price is attempting to stabilize. The immediate ceiling to watch is the local resistance at 96.3800 USDT.
Moving Averages (MA): The short-term trend lines (MA(7) at 96.0114 and MA(25) at 95.8996) are closely aligned near the current price, along with the MA(99) (95.8351), reflecting imminent price compression and temporary indecision between buyers and sellers.
Momentum Indicators (RSI and StochRSI): The RSI(6) is at a neutral level of 36.23, also reflected in the lower StochRSI range (16.14 / 28.90), indicating that the asset is approaching local oversold territory, opening the door to possible relief bounces if buying volume comes in.
Market Sentiment (Long/Short Ratio): Community optimism remains strong, with an L/S Ratio of 3.09, showing an overwhelming 75.53% of Long positions versus 24.47% Shorts, demonstrating that bulls are still betting on a recovery.
💡 What should we expect? The key is to watch whether it can break above 96.38 USDT with volume to confirm continued bullish momentum, or whether it successfully defends support at 95.15 USDT. Risk management and patience are our best allies at this level.
#SOL #BinanceSquare #BinancePick #EarningsSeason #USDCCirculationFallsAbout800MInSevenDays