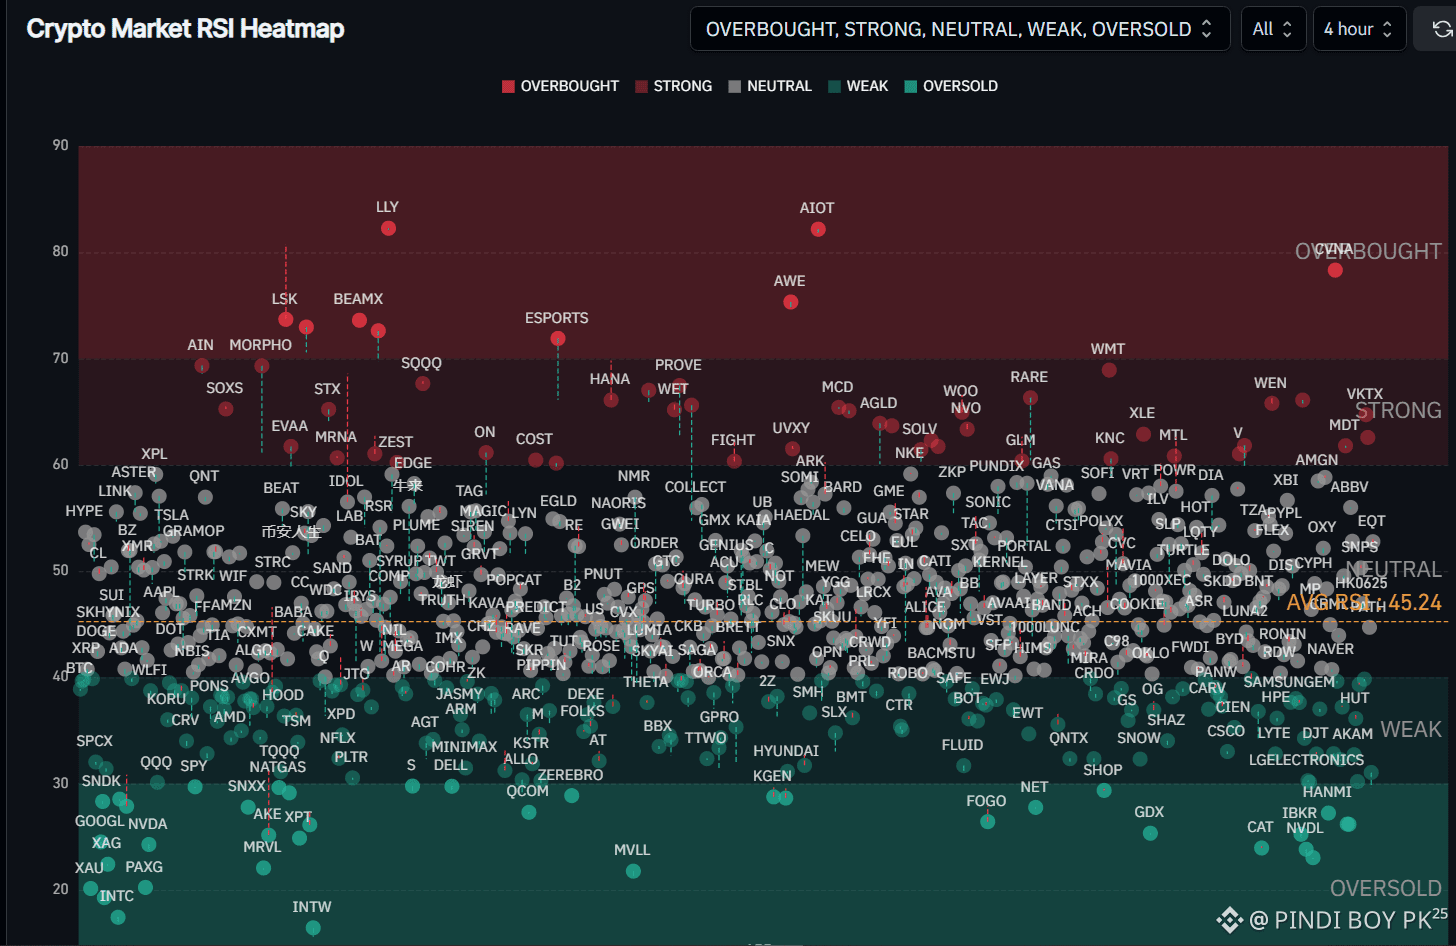

🚨 CRYPTO RSI HEATMAP: OVERBOUGHT ALTCOINS VS HIDDEN OPPORTUNITIES! 📊
The 4-hour RSI heatmap is revealing an interesting split across the crypto market. While some altcoins are showing strong momentum, others are sitting deep in oversold territory. But here's the catch: an extreme RSI reading doesn't automatically mean a reversal is coming.
🔥 Overbought Zone — Momentum Is Heating Up!
Several tokens are trading in elevated RSI territory. $LLY and $AIOT are near 82, while $AWE is around 75. $BEAMX, $LSK, and $ESPORTS are also showing elevated readings. These assets deserve attention, but chasing a strong move without confirmation can be risky.
📉 Oversold Zone — Reversal or Continued Weakness?
Tokens including $INTW, $XAU, $INTC, and $MVLL are showing deeply depressed RSI readings. Oversold conditions can attract buyers, but they can also persist during a strong downtrend. Confirmation matters more than the reading alone.
📊 My Trading Takeaway
Most assets are clustered around the neutral zone, with the displayed average RSI near 45.24. This suggests mixed momentum rather than a clear, market-wide bullish signal.
I'd watch for RSI recovery, price-structure changes, and volume confirmation before taking a position. The best opportunity isn't necessarily the coin with the lowest RSI—it's the one that starts showing evidence of a genuine shift.
Which setup would you rather watch: an overbought breakout or an oversold recovery? 👇
#CryptoMarket #RSI #altcoins #TechnicalAnalysis #CryptoTrading