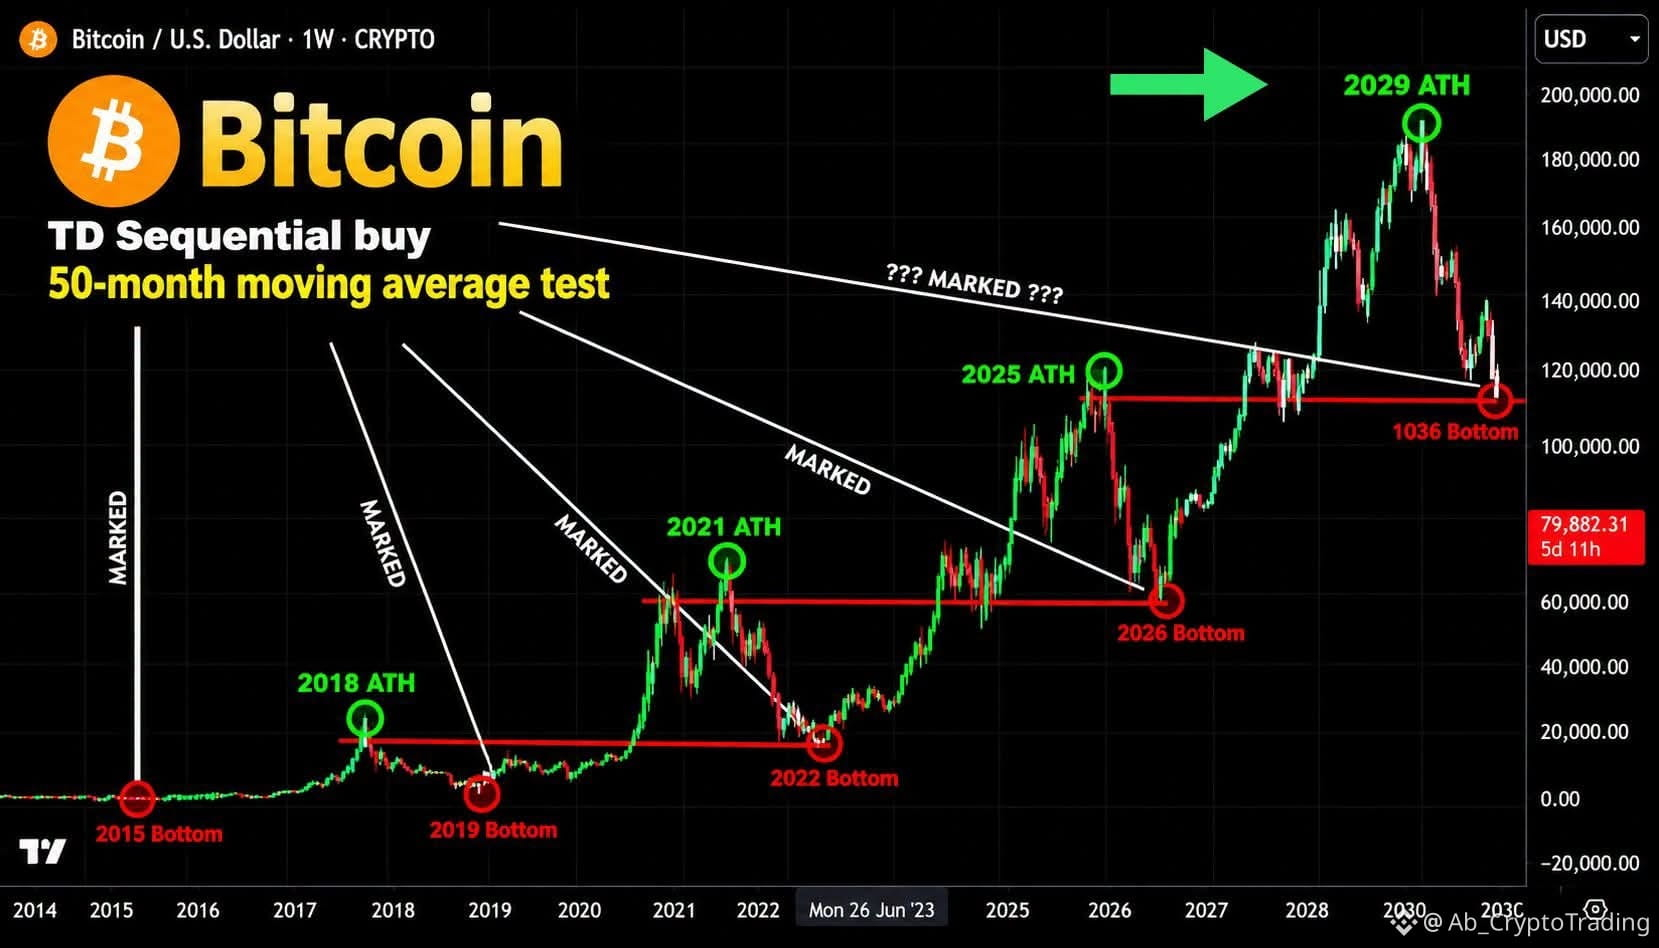
🚨 BITCOIN'S HISTORY MAY BE REPEATING… BUT ARE WE READING THE CYCLE CORRECTLY?
This chart raises an interesting question about Bitcoin's long-term market cycles.
Previous market peaks and bottoms have created patterns that many traders use to anticipate what could come next.
Now, this analysis suggests a possible long-term scenario:
📈 A new cycle high around 2029.
📉 Followed by another major correction toward 2030.
But here's where I want to challenge the idea:
Are Bitcoin's historical cycles still relevant, or has the market evolved too much for these patterns to work the same way?
Consider this:
- Institutional participation is much larger.
- ETFs have changed market access.
- Liquidity and macroeconomic conditions keep evolving.
- Bitcoin's supply dynamics remain different from traditional assets.
So, should we trust historical cycle patterns — or question them?
👇 Which statement do you agree with most?
A) History repeats. Bitcoin's cycle structure is still intact.
B) The cycle is changing. Previous patterns may no longer apply.
C) The long-term bullish trend remains, but the timing is unpredictable.
D) This entire projection is based on pattern-fitting, not reliable evidence.
I'm especially interested in hearing from traders who have followed multiple Bitcoin cycles.
What's the strongest argument AGAINST this chart?
$BTC
#CZSaysCompensationIsinPlaceUsersAreProtected
#YiHe:ProofOfReserves:10TokensAt100%Backing
#USDCCirculationFallsAbout800MInSevenDays
#Write2Earn #EarningsSeason