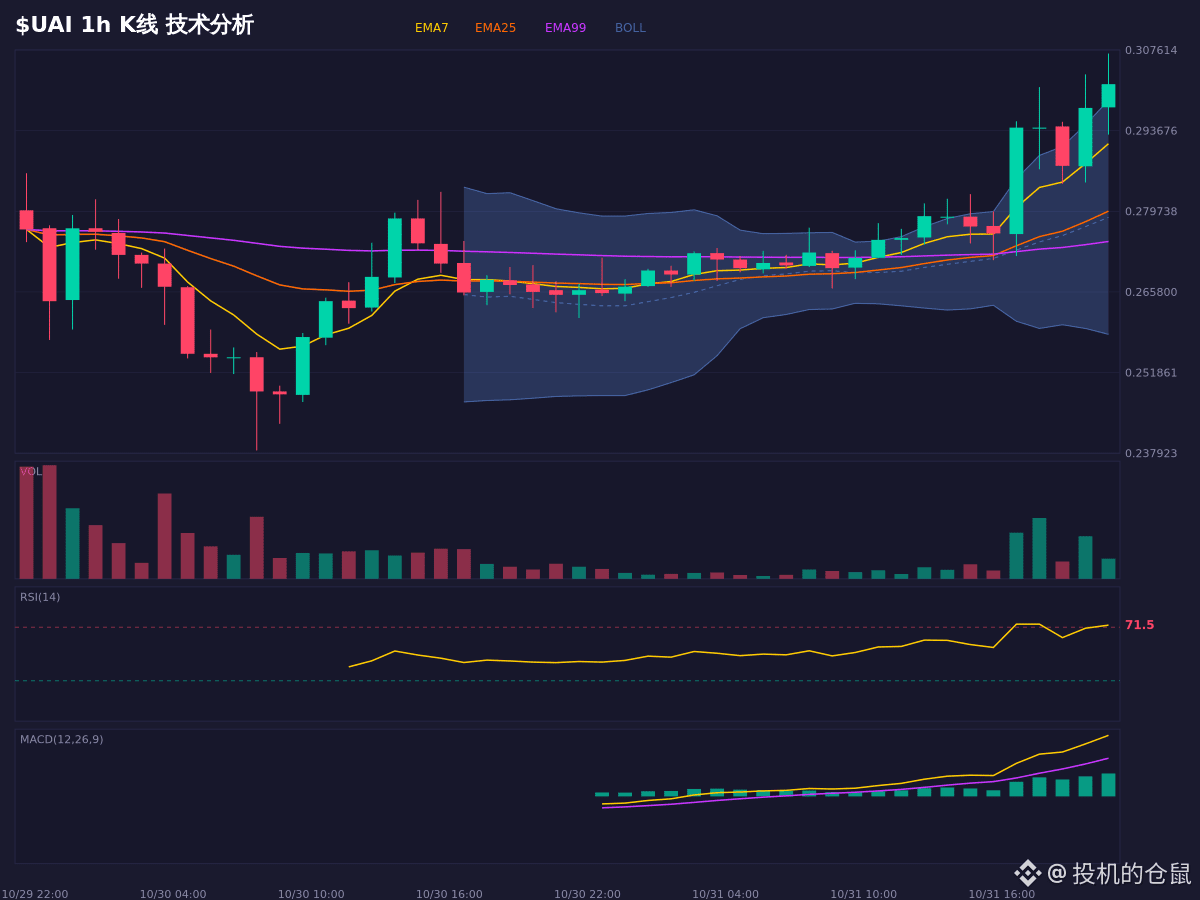
Look, $UAI is up 13%, but technically there are some conflicting signals. Although EMA7/25/99 are in a bullish alignment and bullish MACD momentum is strengthening, pointing to an overall upward trend, the RSI on both the 1H and 4H charts is overbought above 72, and the Stoch RSI %K line has crossed below %D, suggesting short-term pullback pressure.
The price is now at 0.3012, having broken above the upper Bollinger Band at 0.2989, but chasing the price in overbought territory carries considerable risk. If it pulls back to the 0.284–0.289 range and finds support, the bullish trend may continue; but if it falls below 0.274, the current bullish thesis is invalidated.
As for capital flows, OBV shows sustained inflows, the long-short ratio is 2:0, and the funding rate is 0.0093%. Overall sentiment remains bullish. Wow, entering at this level feels like dancing on a tightrope.
For market observation and conditional scenario analysis only; this does not constitute a record of trading activity.
$UAI #交易 #市场情绪 #MarketAnalysis
The price is now at 0.3012, having broken above the upper Bollinger Band at 0.2989, but chasing the price in overbought territory carries considerable risk. If it pulls back to the 0.284–0.289 range and finds support, the bullish trend may continue; but if it falls below 0.274, the current bullish thesis is invalidated.
As for capital flows, OBV shows sustained inflows, the long-short ratio is 2:0, and the funding rate is 0.0093%. Overall sentiment remains bullish. Wow, entering at this level feels like dancing on a tightrope.
For market observation and conditional scenario analysis only; this does not constitute a record of trading activity.
$UAI #交易 #市场情绪 #MarketAnalysis