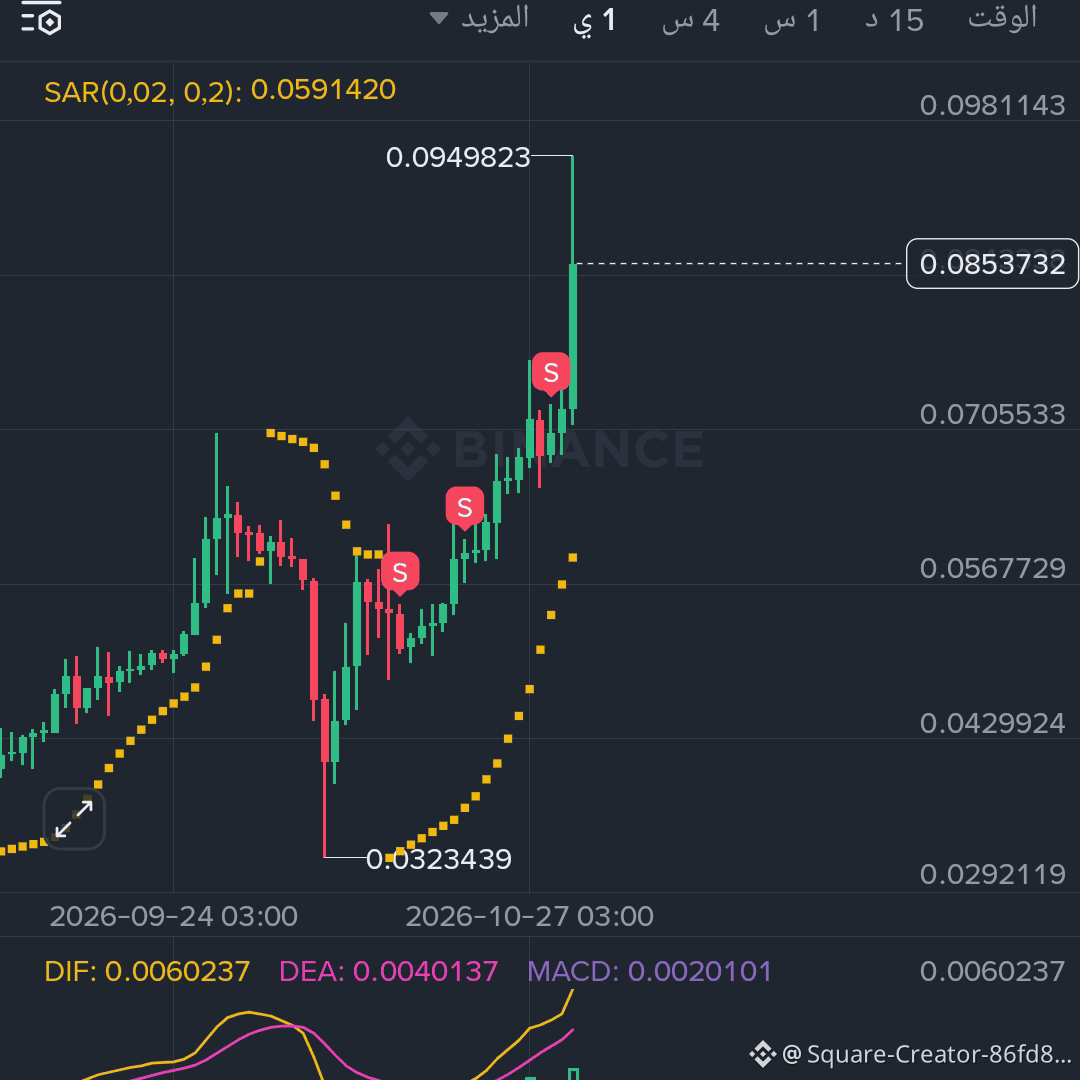
$AIOT
Strong bullish trend — I sold and it rose strongly!!!
USDT -
*Price:* 0.08674$ (+24.57%) | *High:* 0.09430$ | *Low:* 0.06901$ | *Volume:* 50.91M$
1. Trend
- *Trend:* Strong bullish on 1 day
- *Move:* Rise from 0.02931$ to 0.09430$ = 221.7%+
- *Current status:* Price 0.08674$ is close to the top after a 38.92% rise in 7 days and 41.66% in 30 days
- *SAR:* 0.06095$ below price = bullish
- *Distance from SAR:* Price is above SAR by 42.3%
2. Indicators
- *MACD:* DIF 0.00616 above DEA 0.00407
- *Histogram:* 0.00209 green
- *Interpretation:* Bullish crossover, momentum is positive and buyers are in strong control, there is no weakness in the uptrend so far
3. Support and resistance
Level Type Importance
0.09755$ Resistance Upcoming resistance
0.09430$ Resistance Top / 24-hour high
0.08674$ Current price Consolidation zone
0.06901$ Support 24-hour low
0.06895$ Support Nearby support
0.06095$ Support SAR
0.05466$ Support Medium support
0.02931$ Support Bottom
4. Scenarios
*Bullish scenario:*
- Condition: Daily candle close above 0.09430$
- Target: 0.09755$
- After that: New price zone
*Bearish scenario:*
- Condition: Daily candle breaks below 0.06901$
- Target: 0.06095$ SAR
- Loss from current price: 29.7%-
5. Decision
- *Do not enter now:* Price is very close to the top and far from SAR by 42.3%
- *Correct entry:* Daily close above 0.09430$, or a rebound from 0.06901$ / 0.06095$
- *Stop:* Below 0.06095$ on a daily close
6. Summary
*Strong rise of 221.7%+ from the bottom, the trend is bullish, MACD is green, and SAR is below price. #IntelHasItsWorstDaySince1974