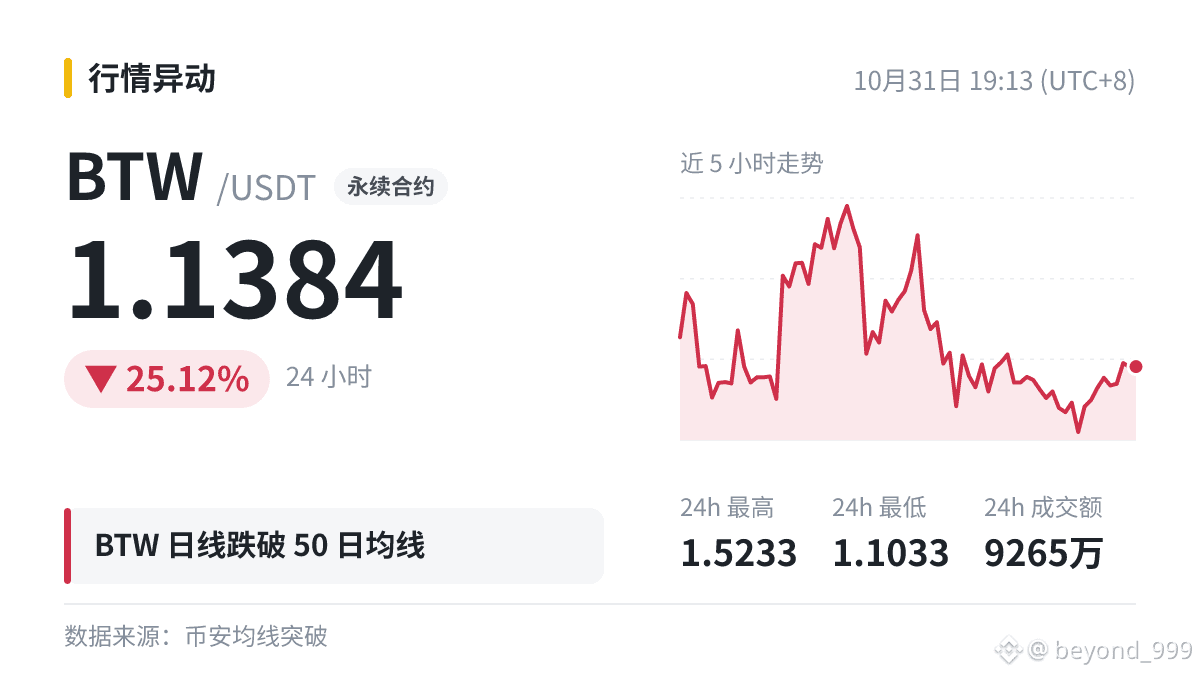
🐋 $BTW broke below MA50 on the daily chart (1.3484), 24h -25.12%.
Moving averages are levels that many medium- to long-term traders watch, so let's first understand what they are.
A moving average is the average closing price of the most recent N candlesticks. Each time a new candlestick closes, the calculation shifts forward by one candle; connecting the values forms the moving average line.
Extreme data usually comes with more violent volatility. At times like these, it's better to reduce your position rather than make a big bet.
#BTW