XPR Network $XRP — Latest Analysis
31 October 2026 · Latest available market data

### XPR Network (XPR)
### $0.00184
Approximate live-market snapshot
Bearish trend
24-hour range
### $0.00180–$0.00186
7-day performance
### −3.3%
30-day performance
### −23.3%
Market cap
### ~$62 million
Sources: Goodreturns +1 Prices vary by exchange and update continuously.
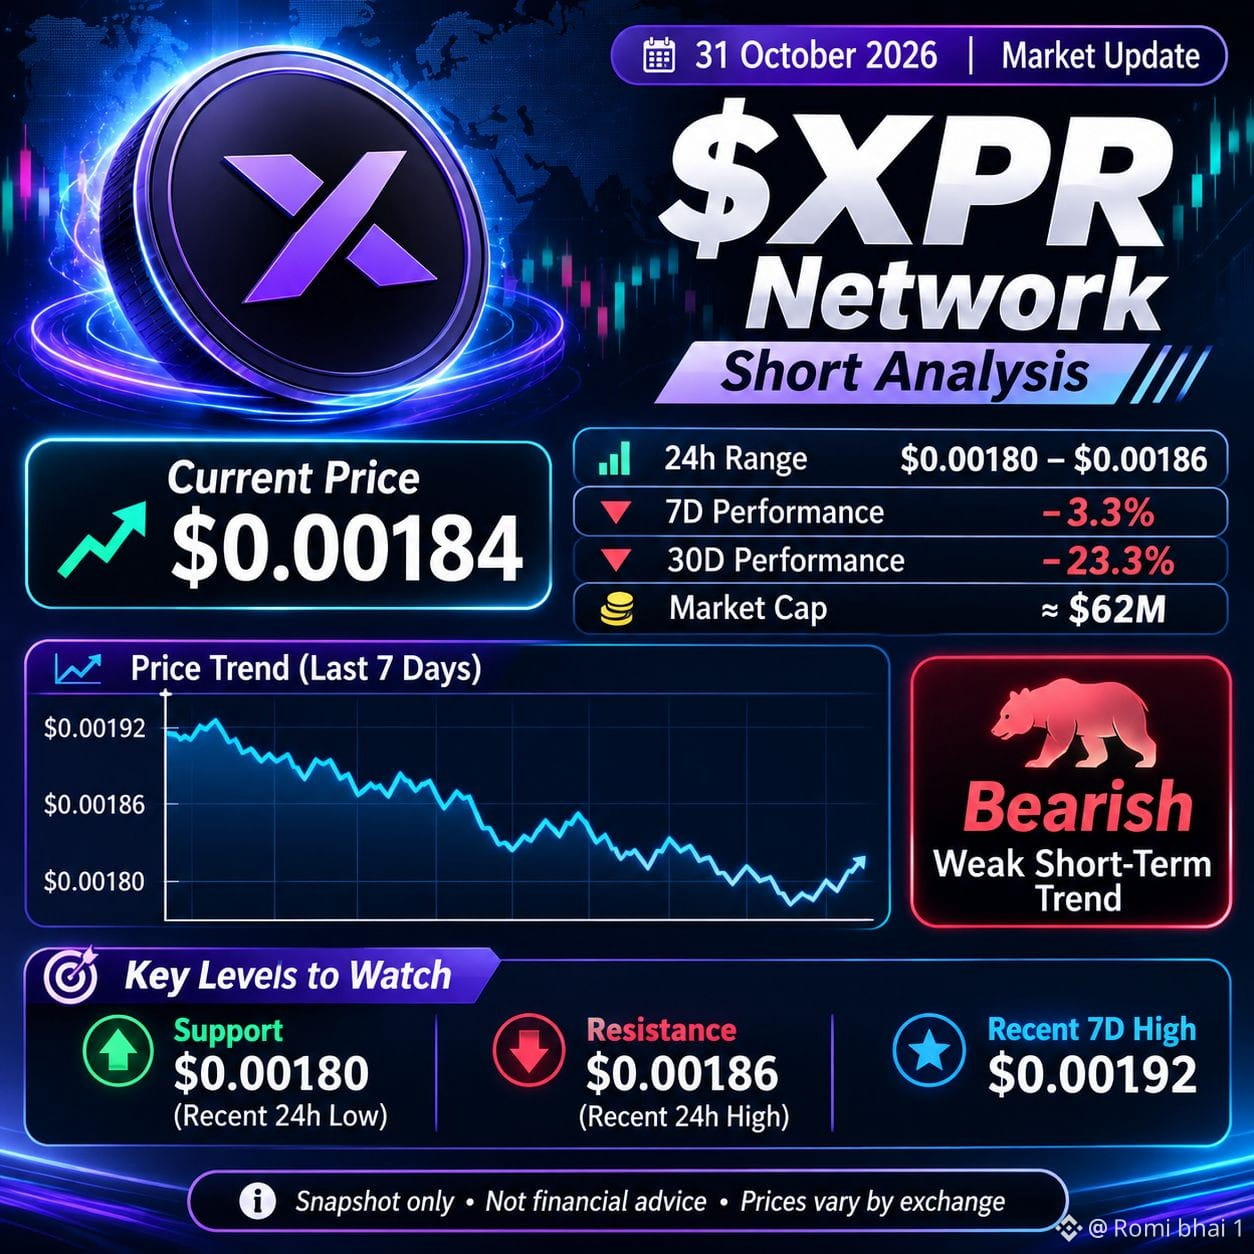
Short analysis: XPR is showing a weak short-term trend despite a small intraday recovery. The price is near the lower end of its recent trading range, while the roughly 23% monthly decline suggests selling pressure remains significant. Goodreturns +1
### Key levels to watch
* Support: $0.00180 — a break below this could indicate further weakness.
* Resistance: $0.00186, then $0.00192.
* Bullish signal: Price moves above resistance and holds with stronger trading volume.
* Bearish signal: Price falls below support and fails to recover.
My view: Short-term bias is bearish to sideways. Avoid assuming a reversal from a small bounce alone. The levels above are reference points from recent price data, not guaranteed turning points. CoinGecko +1
The picture is a visual summary of the market snapshot, not a live trading chart. Crypto prices can change rapidly; this is informational analysis, not financial advice.
31 October 2026 · Latest available market data

### XPR Network (XPR)
### $0.00184
Approximate live-market snapshot
Bearish trend
24-hour range
### $0.00180–$0.00186
7-day performance
### −3.3%
30-day performance
### −23.3%
Market cap
### ~$62 million
Sources: Goodreturns +1 Prices vary by exchange and update continuously.
Short analysis: XPR is showing a weak short-term trend despite a small intraday recovery. The price is near the lower end of its recent trading range, while the roughly 23% monthly decline suggests selling pressure remains significant. Goodreturns +1
### Key levels to watch
* Support: $0.00180 — a break below this could indicate further weakness.
* Resistance: $0.00186, then $0.00192.
* Bullish signal: Price moves above resistance and holds with stronger trading volume.
* Bearish signal: Price falls below support and fails to recover.
My view: Short-term bias is bearish to sideways. Avoid assuming a reversal from a small bounce alone. The levels above are reference points from recent price data, not guaranteed turning points. CoinGecko +1
The picture is a visual summary of the market snapshot, not a live trading chart. Crypto prices can change rapidly; this is informational analysis, not financial advice.