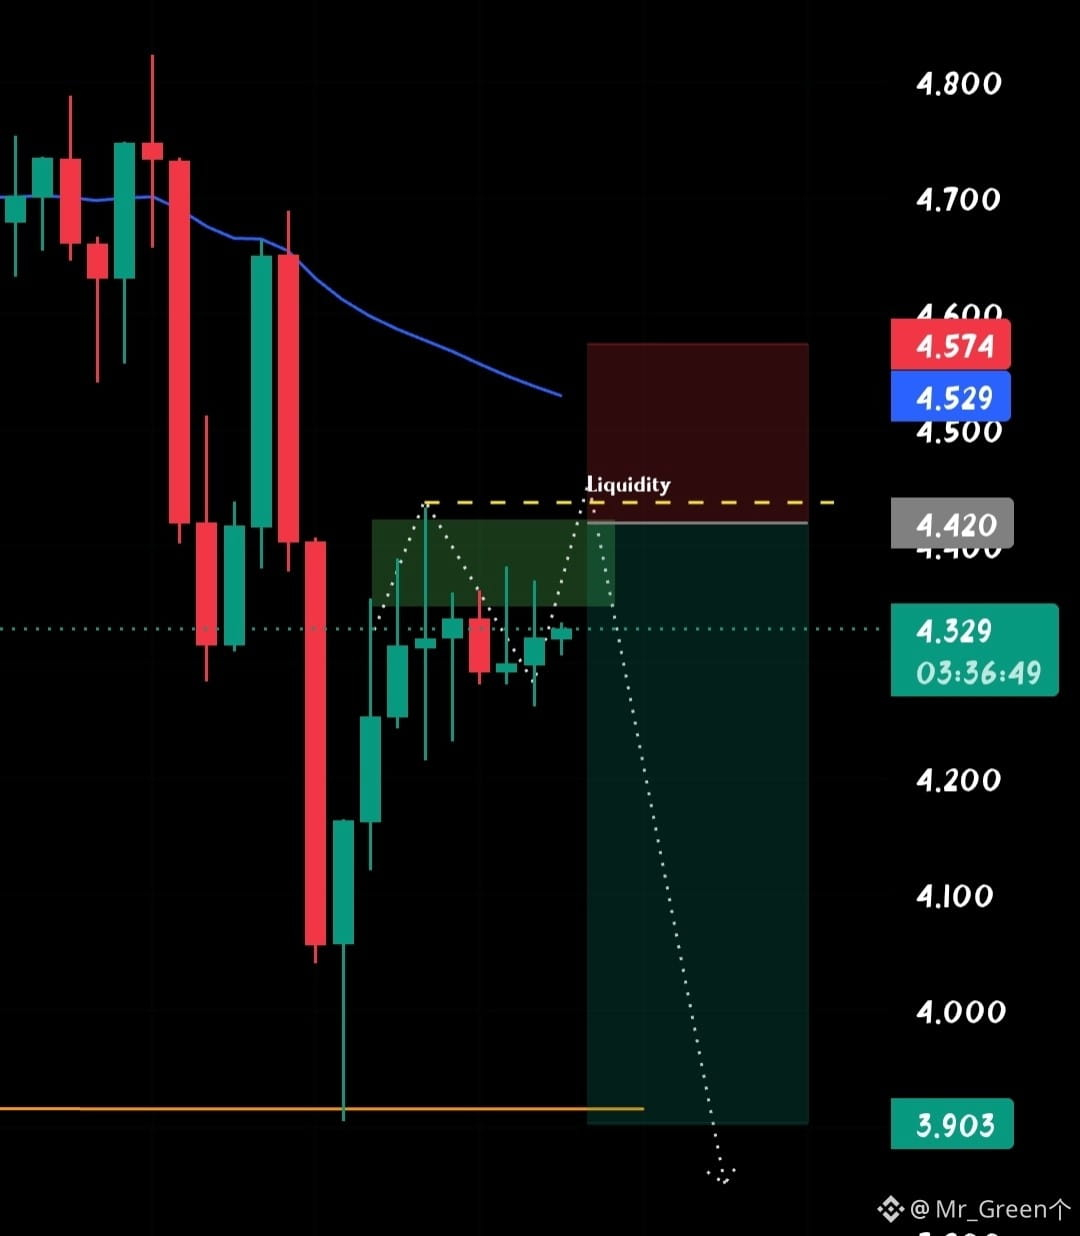

🔴 $NEAR — BUYERS ARE FIGHTING HARD, BUT FOR HOW LONG? 👀
Take a look at NEAR. After that sharp recovery from the $4.00 area, buyers have been trying their best to push the price higher. But something doesn't look right to me.
Every time price enters this green resistance zone around $4.32–$4.42, sellers show up. Multiple rejections, weak follow-through and difficulty breaking above the zone.
Meanwhile, EMA 50 is sitting around $4.53, acting as another overhead resistance.
Here's the scenario I'm watching:
First, I want to see price grab the liquidity sitting above $4.42. That could be the final opportunity for late buyers before sellers take control.
But I'm not entering blindly!
I want to see a strong bearish displacement candle after the liquidity sweep, preferably breaking the short-term structure on the 5–15 minute chart.
📍 SHORT Setup — $NEAR
Entry zone: $4.42 (after confirmation)
Stop-loss: $4.574
TP1: $4.20
TP2: $4.00
TP3: $3.903
My take: Buyers are still defending, but repeated rejection suggests that bullish momentum may be weakening. A liquidity sweep followed by strong bearish confirmation could offer an interesting SHORT opportunity.
One thing: don't short just because price touches the zone. Let the 5–15m candles confirm the rejection first.
Sometimes the best trade comes after everyone becomes convinced that the next candle must be green. 😂
Keep an eye on $NEAR . This setup could get interesting!
Follow for more real chart analysis! 👇
#Near #NEAR🚀🚀🚀