$BTC
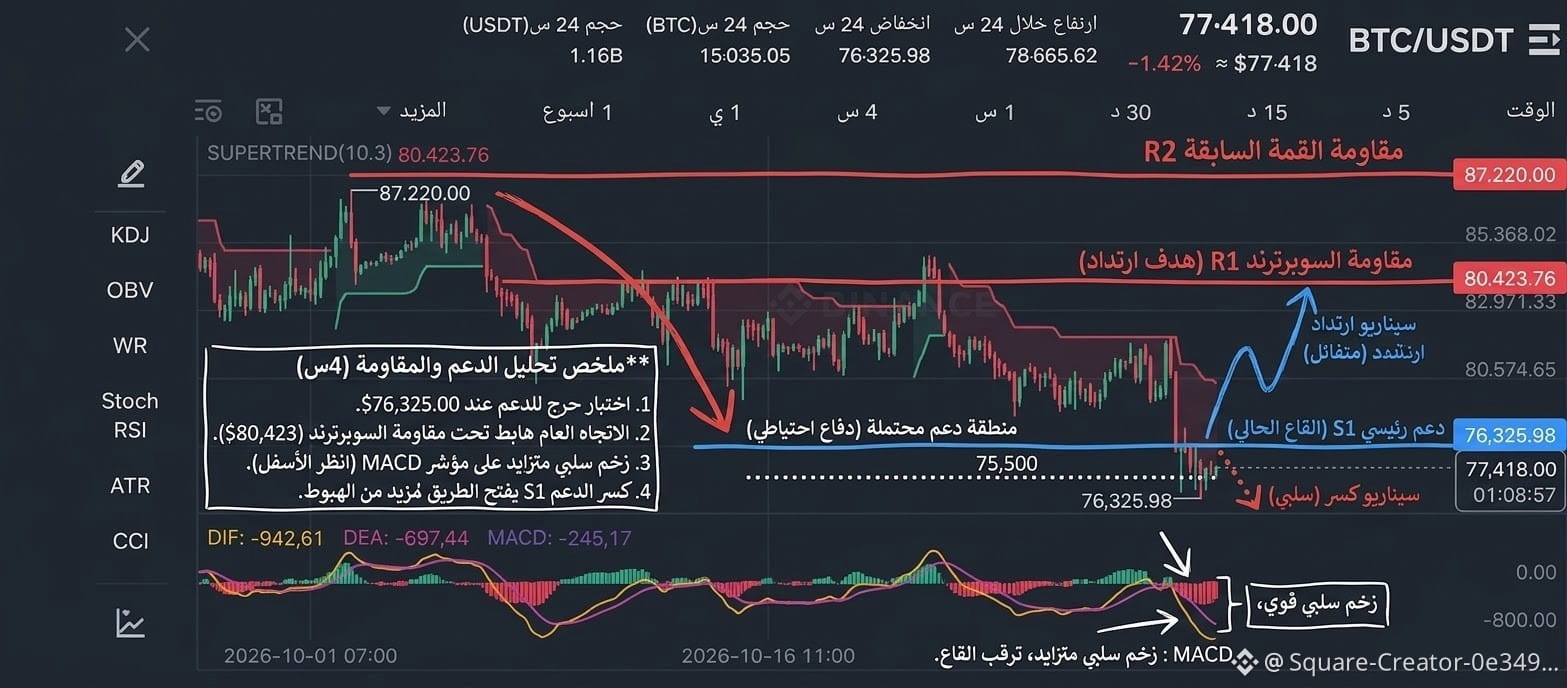
Overall trend: The chart currently shows a downward trend, with the price trading below the Supertrend line (red).
Main support S1 (76,325.98): The price is now testing this critical support, which is the latest low. Holding above it is essential to prevent further declines.
Nearby resistance R1 (80,574.65): This represents the first strong barrier in the event of an upward rebound. Breaking above it would be the first positive signal.
Major resistance R2 (87,220.00): This is the distant target if the bullish scenario plays out, and represents a very strong double-top zone.
Expected scenarios (as indicated by the arrows):
Bullish scenario (upward blue arrow): If the price manages to hold above support S1, we may see a rebound to test resistance R1. Breaking above R1 would open the way to target the peak at R2.
Bearish scenario (downward red arrow): If support S1 is broken, the decline is expected to continue toward deeper levels, as there is no clear nearby support on this chart.