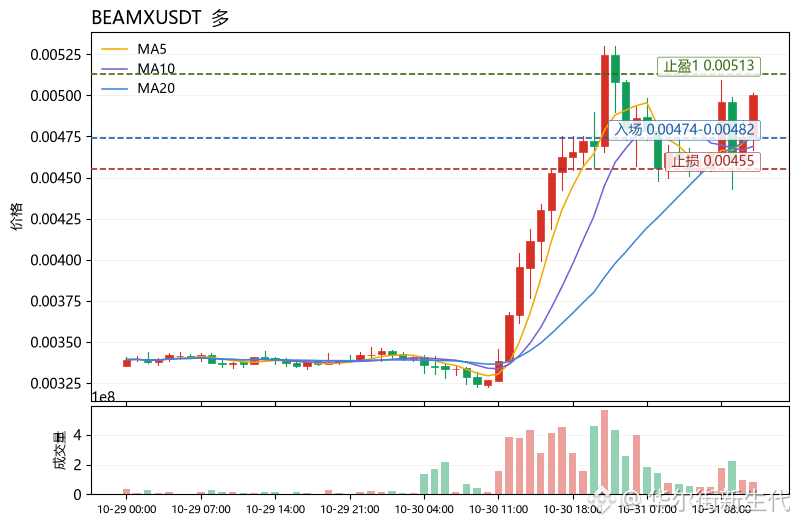
$BEAMX is currently at 0.005, up 52.77% over 24h, with a trading volume of 28.1M USDT. It is the only one of the three candidates this round to double on a surge in volume. Compared with $PENDLE , up just 10.88% over the same period, and $SNXXB , down 22.42%, the relative strength gap within the sector is clear. The MA5 at 0.004795 has crossed above the MA20 at 0.0047452, and the price is holding above both moving averages, indicating a bullish trend structure. RSI at 63.9 is approaching the strong zone but is not overbought, leaving room for further upside.
The concern is that the MACD histogram is at -2.896e-05, so momentum has yet to turn positive. The price at 0.005 is also close to the Bollinger upper band at 0.0051272, making the risk of chasing a short-term peak significant. The +0.0050% funding rate indicates that longs are paying, suggesting overheated sentiment. Combined with a Fear & Greed Index of just 30 (Fear), this points to a structurally strong move concentrated in capital flows rather than a broad bull market. Waiting for a pullback and confirmation is more reasonable than chasing the price higher.
The outlook is bullish, but only on a pullback—not at the top. Reference entry: 0.00474–0.00482, the support zone formed by the MA20 and MA5. If the price holds on a pullback, the bullish structure remains valid. Take-profit 1: 0.00513, the resistance at the Bollinger upper band. Take-profit 2: 0.00545, an extension target after a breakout above the upper band. Stop-loss: 0.00455; a break below the MA20 and loss of the Bollinger mid-band area would invalidate the structure. An RSI pullback to around 55, together with the MACD histogram turning positive, would confirm a signal to add to the position.
Also on the radar: PENDLE has bullish moving averages, but its funding rate has turned negative; its relative strength is weaker than BEAMX. SNXXB is near the edge of an oversold rebound, with RSI at just 30.6, and is clearly lagging in the relative strength ranking.
(Personal opinion for reference only; this is not investment advice. Contracts carry extremely high risk. Please manage position sizes strictly.)
【Data】
Coin: BEAMXUSDT
Direction: Long
Entry: 0.00474-0.00482
Take-profit 1: 0.00513
Take-profit 2: 0.00545
Stop-loss: 0.00455