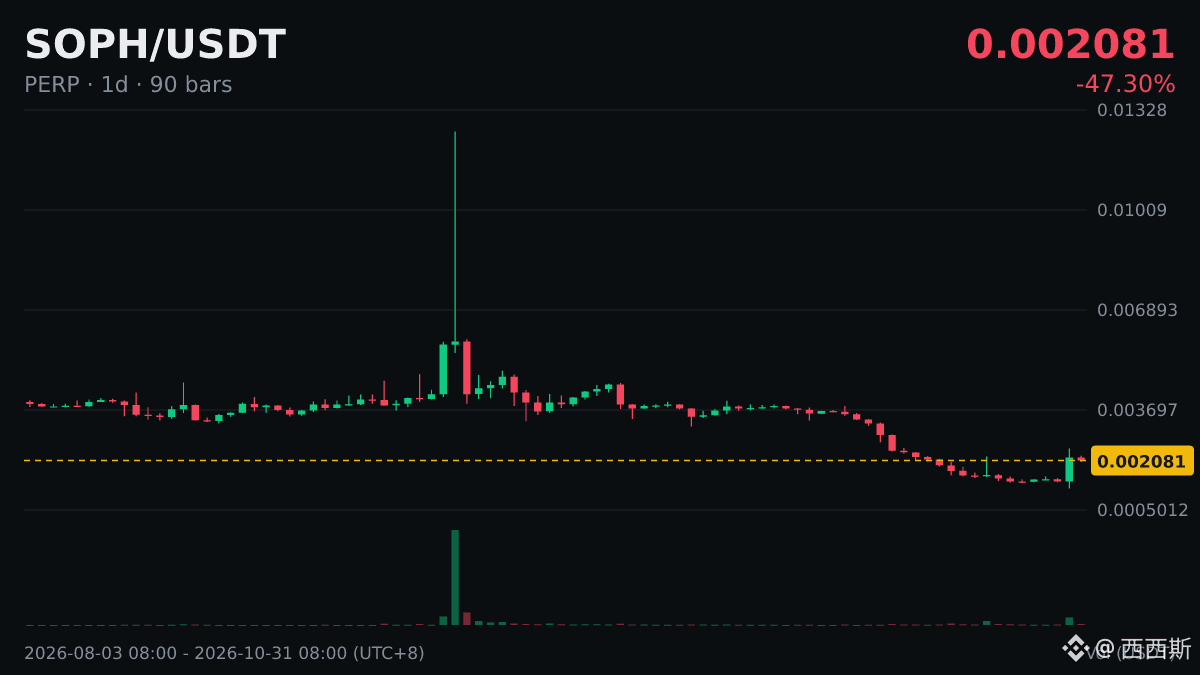
Hard data at a glance:
▫️ Asset: $SOPH
▫️ Daily MACD: bullish crossover below the zero line
▫️ Bearish momentum bars before the crossover: 22 daily candlesticks
▫️ 24h: +63.28%
Interpretation: Bearish pressure is easing, suggesting a rebound. The trend is one step away from turning bullish—the DIF needs to return to the zero line.
▫️ Asset: $SOPH
▫️ Daily MACD: bullish crossover below the zero line
▫️ Bearish momentum bars before the crossover: 22 daily candlesticks
▫️ 24h: +63.28%
Interpretation: Bearish pressure is easing, suggesting a rebound. The trend is one step away from turning bullish—the DIF needs to return to the zero line.