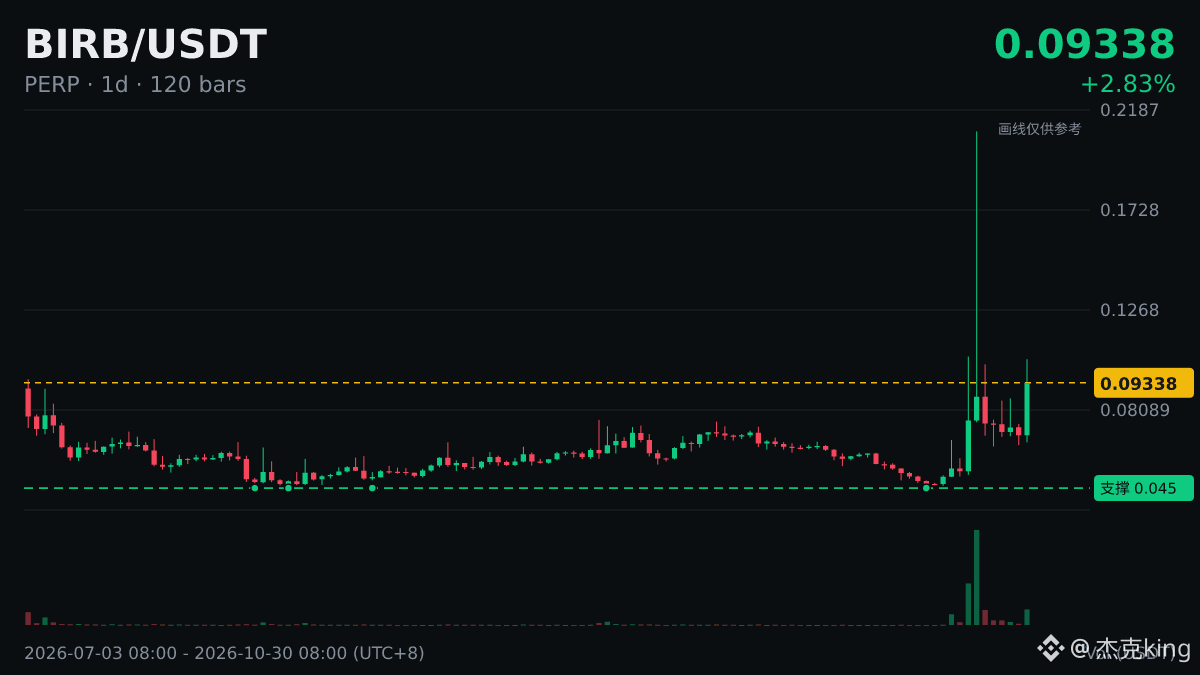
$BIRB The daily chart is above MA200 (0.07978).
Let’s use this figure to break down moving averages.
Moving averages themselves are also viewed as dynamic support and resistance: when price pulls back toward one from above, many people watch to see whether it holds.
Whether volume increases when price moves above or breaks below a moving average is also used as a guide: a move on low volume is more likely to be just a brief test.
Before trading with leverage, first consider whether you can withstand the worst-case outcome, then look at what the signals are saying.
#BIRB