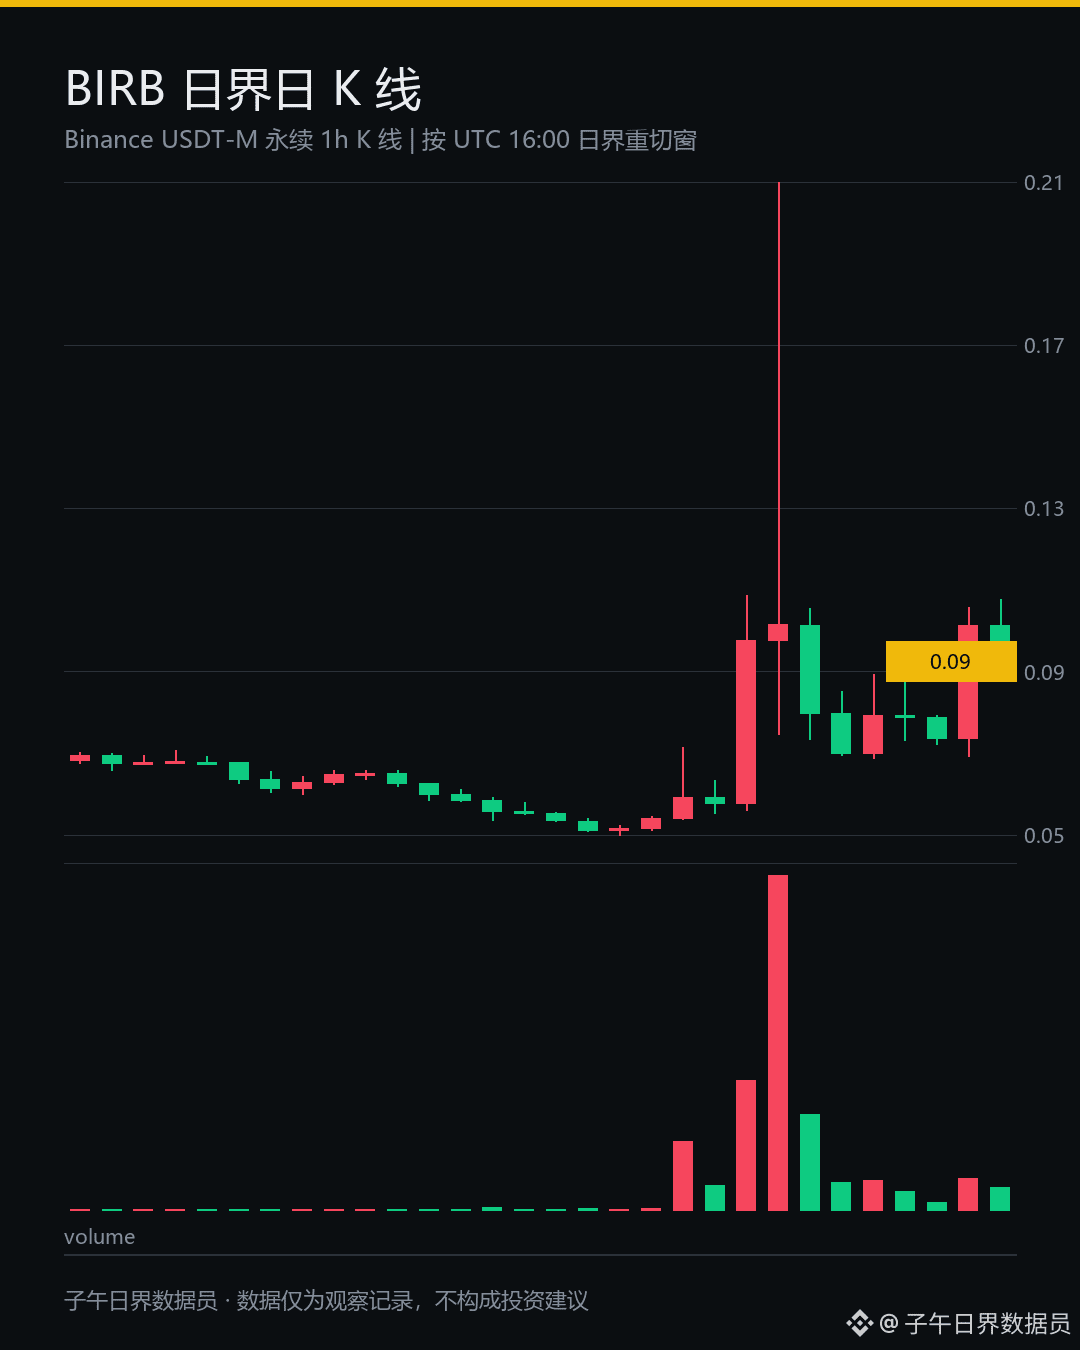
BIRB made quite a move today—I actually paused with my hand on the mouse while watching the chart.
Over the past 24 hours, it’s up 29.327%, with a high of 0.10423 and a low of 0.06476—a 60.9% range.
That’s intense.
One 4-hour candle shot straight from 0.07467 to 0.09753, with 421 million tokens traded.
The candles before that had been hovering between just over 10 million and 80 million.
At first glance, I thought I was seeing things. I checked twice before I believed it.
Then the next 4-hour candle opened at 0.09755, surged to 0.10423, and turned back down,
closing at 0.08826, down 9.50% on the candle, with 465 million tokens traded.
It went up fast and came back down just as decisively.
The total trading volume for the day was 99.74 million USDT, across 1.49 million trades. That many trades weren’t made by one whale;
retail traders all crowded in at the same time to grab liquidity, then scattered once they’d gotten it.
It’s like someone grabbed it by the collar, yanked it from the floor to the ceiling, then let go.
The market can only absorb so much. It’s gone through a month’s worth of price action in a single day, leaving buyers holding tokens halfway up the mountain. I don’t touch levels where there’s no one willing to step in and buy.
By my criteria, the price action after a move this volatile hasn’t played out yet. I’m choosing to pay less attention and wait for it to find its footing.
What do you all think of a coin that packs a month’s worth of moves into one day? Let’s talk in the comments.
$BIRB $BTC $ETH
#BIRB #比特币 #Cryptocurrency
The above is a record of my personal trading system and observations of market data; it does not constitute investment advice.