$ETH Crypto Academician: 10/31 Ethereum (ETH) Breaks Below Key Support—Yet I See an Opportunity Everyone Else Has Overlooked
A couple of opening thoughts: Honestly, this market lately is really not suited to taking large positions. It can’t seem to rally, and it doesn’t fall hard either—it just grinds away at you. Long and short positions getting liquidated in both directions has become commonplace. I know some of you are always itching to trade; going a day without a trade feels unbearable. But think about it: after ten trades back and forth, have you made enough to cover the loss from a single stop-loss? With trading, less is more. Patience matters more than anything. Spend the weekend with your family, and don’t keep staring at the candlesticks. The market will be there every day, but you only have one body. Let’s pick this up again tomorrow!
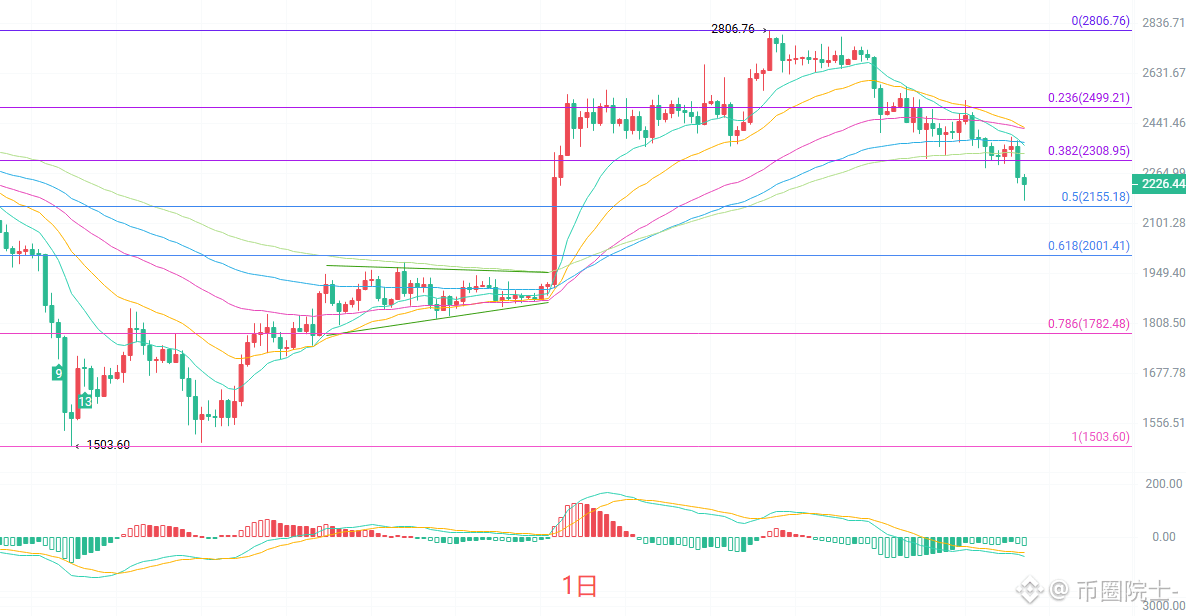
The daily moving averages are in a full bearish alignment, with EMA15 at 2364 and EMA30 at 2425. Price has moved far below the short-term moving averages. The MACD histogram is still expanding in the negative direction, indicating that downward momentum has not yet run its course. The Bollinger Bands are opening downward, and the middle band at 2393 has become strong resistance. The lower band at 2247 was also broken today. Price is currently in oversold territory, but oversold does not mean an immediate rebound—don’t rush to catch a falling knife.
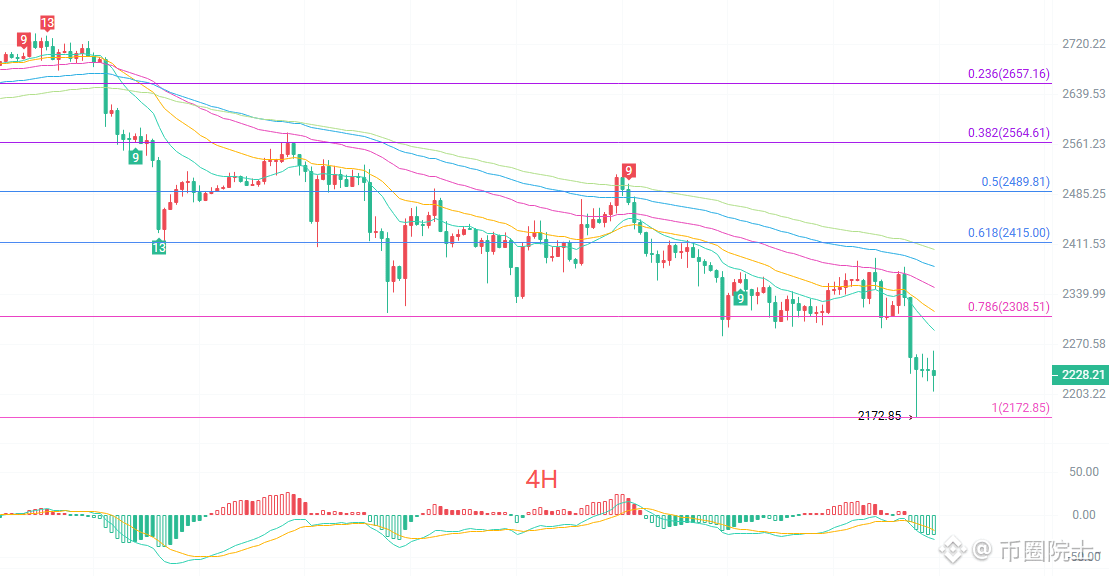
On the four-hour chart, the TD sequence has reached 5, meaning the fifth candlestick of the decline has appeared. Keep an eye out for a possible TD 9 signal that could trigger a short-term rebound. As for the moving averages, EMA15 is at 2289 and EMA30 at 2315. Price is trading entirely below all the moving averages, a typical weak-market pattern. The MACD reading is positive but has clearly turned downward, and the red histogram bars are steadily shrinking, showing that bullish momentum is fading. The lower Bollinger Band at 2219 is key short-term support. If this level breaks as well, there will be room for further downside.
Short-term reference:
Long: Resistance in the 2200–2150 area; stop-loss at 30 points; target 2250–2300.
Short: Losing momentum in the 2300–2350 area; stop-loss at 30 points; target 2250–2200.
For specific trades, rely on real-time order-book data. For more information, you can contact the author. This article may be delayed; it is for reference only, and you assume all risks.
#ETH走势分析 #ETH futures