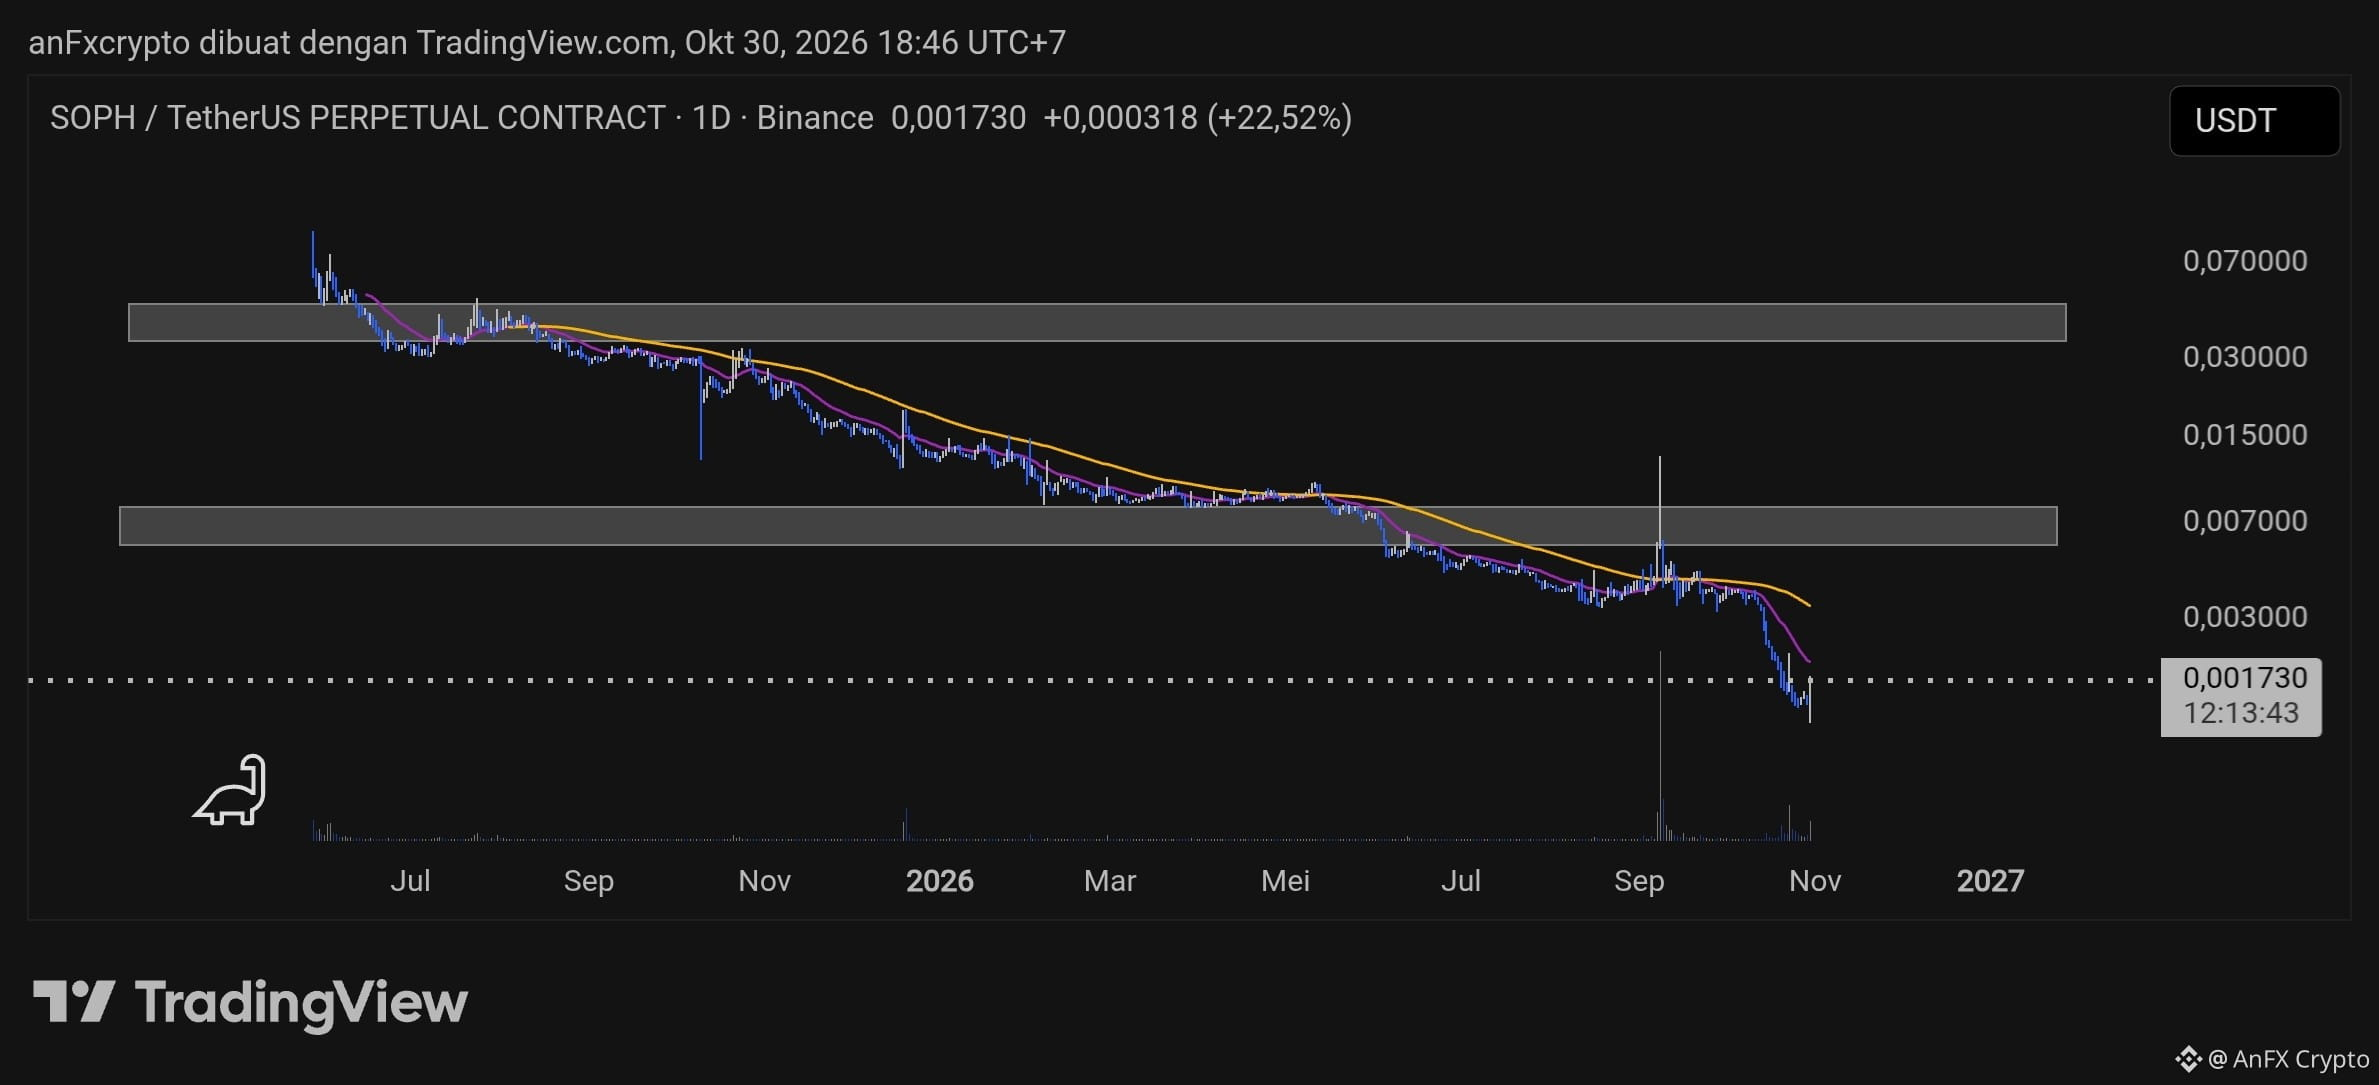
Technical Analysis $SOPH /USDT (1D)
Main Trend: Very strong long-term bearish trend (Strong Downtrend). The price continues to set new record lows (lower lows) below the main Moving Average (MA) lines.
Price Structure: Failed to hold above the previous psychological support zone, indicating massive selling pressure without any significant buyer accumulation.
Momentum Indicator: The MA lines show a steep downward trend, confirming the absolute dominance of sellers.
Trading Signal
Recommendation: SHORT (Following the major trend)
Entry: In the short-term corrective rebound area around $0,00160 - $0,00173
Take Profit (TP):
TP1: $0,00130
TP2: $0,00100
Stop Loss (SL): Above $0,00195 (to limit risk in case of a false reversal)
Risk Note: A small-cap asset with extreme volatility. Use low leverage and strict risk management.