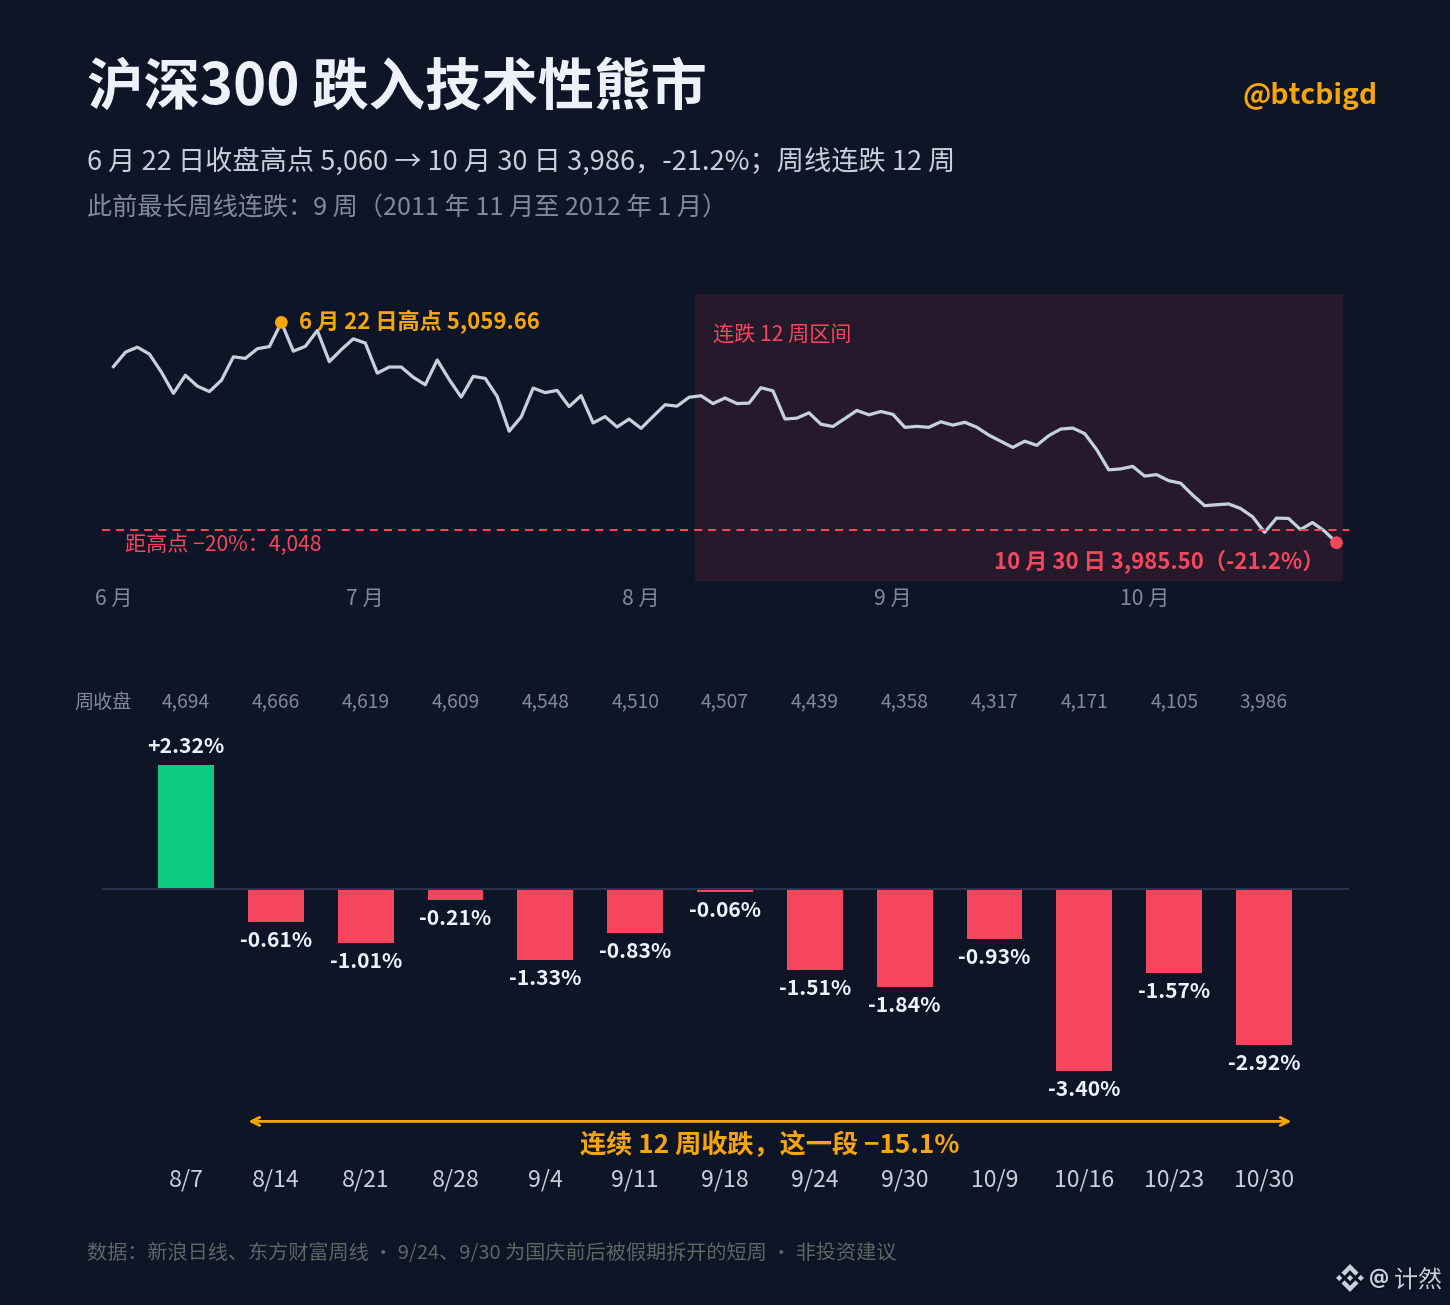
The CSI 300 has entered a technical bear market! Down 21.2% from its June high, with 12 consecutive weekly losses 😨
At the close on October 30, the CSI 300 fell below 4,000 points, closing at 3,985.50, down 1.39% for the day. This was its lowest close since July 7, 2025.
[Key figures]
- The closing high for this rally was 5,059.66 on June 22. By October 30, the index was down 21.2%, breaking through the 20% threshold for a technical bear market.
- It first fell below the −20% mark at the close on October 22, then rebounded to −18.9% on October 23, before dropping below it again on October 29.
- The index has posted 12 consecutive weekly losses since the week of August 14, falling 15.1% over that stretch. Since the index was launched in 2005, its previous longest losing streak was 9 weeks (November 2011 to January 2012).
- The 12-week streak includes two shortened weeks—September 24 and September 30—split by the National Day holiday.
[How to read this]
This has been a gradual grind lower: the biggest weekly decline in the 12-week stretch was −3.40% in the week of October 16, while most of the others were under −2%.
Assessment: A long decline doesn’t mean the market has fallen far enough. Wait for a sustained signal from policy or capital flows that can reverse the trend; don’t assume a bottom just because prices have “fallen a lot.”
Growth stocks were weaker on October 30: the ChiNext Index fell 4.13%, and the STAR 50 fell 5.48%. Crypto markets were also digesting the $6.3 billion Binance hack that day, with $BTC down about 4% from before the incident. It’s been a tough time for both markets.
Follow me for continued updates on the A-share and crypto markets.
#A股 #CSI300
At the close on October 30, the CSI 300 fell below 4,000 points, closing at 3,985.50, down 1.39% for the day. This was its lowest close since July 7, 2025.
[Key figures]
- The closing high for this rally was 5,059.66 on June 22. By October 30, the index was down 21.2%, breaking through the 20% threshold for a technical bear market.
- It first fell below the −20% mark at the close on October 22, then rebounded to −18.9% on October 23, before dropping below it again on October 29.
- The index has posted 12 consecutive weekly losses since the week of August 14, falling 15.1% over that stretch. Since the index was launched in 2005, its previous longest losing streak was 9 weeks (November 2011 to January 2012).
- The 12-week streak includes two shortened weeks—September 24 and September 30—split by the National Day holiday.
[How to read this]
This has been a gradual grind lower: the biggest weekly decline in the 12-week stretch was −3.40% in the week of October 16, while most of the others were under −2%.
Assessment: A long decline doesn’t mean the market has fallen far enough. Wait for a sustained signal from policy or capital flows that can reverse the trend; don’t assume a bottom just because prices have “fallen a lot.”
Growth stocks were weaker on October 30: the ChiNext Index fell 4.13%, and the STAR 50 fell 5.48%. Crypto markets were also digesting the $6.3 billion Binance hack that day, with $BTC down about 4% from before the incident. It’s been a tough time for both markets.
Follow me for continued updates on the A-share and crypto markets.
#A股 #CSI300