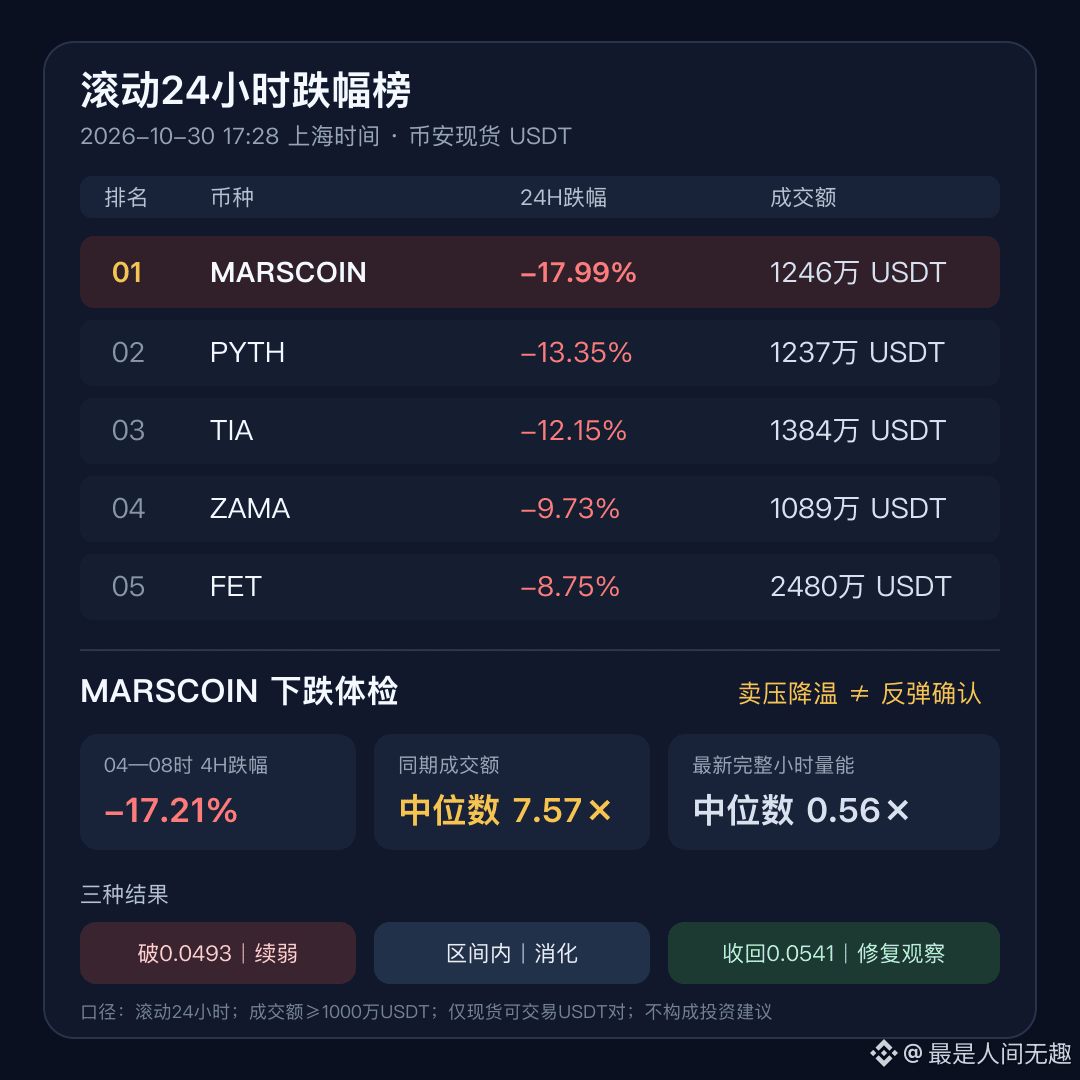
Does being the biggest loser mean something went wrong with the project? The price and volume action of $MARSCOIN looks more like “selling pressure easing, rebound not yet confirmed”
At 17:28 on October 30 (Shanghai time), based on publicly available Binance spot data, filtering for tradable USDT spot pairs with 24-hour trading volume of at least 10 million USDT and excluding stablecoins, fiat currencies, leveraged tokens, tokenized traditional assets, and obvious outliers, the five biggest losers over the rolling 24-hour period were: MARSCOIN -17.99% (12.46 million USDT in trading volume), PYTH -13.35% (12.37 million), TIA -12.15% (13.84 million), ZAMA -9.73% (10.89 million), and FET -8.75% (24.80 million). Of 53 qualifying assets, 44 were down and 9 were up; the median return was -3.35%, indicating a clearly weak market beta. However, MARSCOIN fell about 14.64 percentage points more than the median, so the broader market alone cannot explain its decline.
First, look at the confirmed selling pressure. Over the full 4-hour period from 04:00 to 08:00, MARSCOIN fell from 0.0645 to 0.0534, a single-period decline of 17.21%, with trading volume of about 5.6866 million USDT—7.57 times the median for the previous 12 full 4-hour periods. From 08:00 to 12:00, it continued lower to 0.0493 on 4.17 times the median volume, closing at 0.0529. These two periods show that the decline was not a low-volume drift: aggressive selling and a liquidity shock were both present.
Next, consider the change at the margin. From 12:00 to 16:00, trading volume over the full 4-hour period fell to 1.05 times the median, while the price moved from a close of 0.0529 to 0.0524. In the latest full hour, from 16:00 to 17:00, it closed at 0.0520, down from 0.0524, on just 158,300 USDT in volume—0.56 times the median for the previous 24 hours. Selling pressure has eased, but the snapshot price of 0.0515 is only 4.46% above the intraday low of 0.0493; low volume does not automatically mean a rebound.
As for the cause, Binance’s September 4 listing announcement explicitly described MARSCOIN as a meme token on BNB Chain and assigned it a Seed Tag, warning that its volatility and risk are higher than those of conventional assets. The project’s website currently shows about $1.2 million in on-chain liquidity and a 3% tax on both buys and sells. However, these are details about the on-chain market; they cannot be treated as a direct measure of Binance spot order-book depth, nor can they explain today’s concentrated selling pressure. I found no verifiable project-specific incident or negative announcement from October 30, so the claim that “the project suddenly imploded” remains unsubstantiated.
From here, watch for just three possible outcomes:
Further deterioration: A full 1-hour candle closes below 0.0493 on increased volume, with trading volume rising back above about 282,400 USDT. This would indicate that active selling has confirmed a break of the low.
Consolidation near the lows: The price stays between 0.0493 and 0.0541 while volume continues to decline. This would indicate that panic selling is easing, but would not yet qualify as a trend reversal.
Recovery begins: A full 1-hour candle closes back above 0.0541 on increased volume, followed by a full 4-hour candle reclaiming 0.0645. That would first recover the local structure, then invalidate the concentrated selloff. If it holds above 0.0645 on strong 4-hour volume, the view that “the decline remains driven by selling pressure” would no longer hold.
The main risks are the volatility and slippage of a Seed Tag asset, differences in depth between on-chain and centralized markets, fluctuations in candles that have not yet closed, and mistaking a low-volume pause in the decline for a return of buyers. First, open the core trading pair page and check the latest completed hourly volume, then see which side—0.0493 or 0.0541—gets confirmed at the close. Only when price and volume both turn will a rebound move from speculation to a verifiable setup.
At 17:28 on October 30 (Shanghai time), based on publicly available Binance spot data, filtering for tradable USDT spot pairs with 24-hour trading volume of at least 10 million USDT and excluding stablecoins, fiat currencies, leveraged tokens, tokenized traditional assets, and obvious outliers, the five biggest losers over the rolling 24-hour period were: MARSCOIN -17.99% (12.46 million USDT in trading volume), PYTH -13.35% (12.37 million), TIA -12.15% (13.84 million), ZAMA -9.73% (10.89 million), and FET -8.75% (24.80 million). Of 53 qualifying assets, 44 were down and 9 were up; the median return was -3.35%, indicating a clearly weak market beta. However, MARSCOIN fell about 14.64 percentage points more than the median, so the broader market alone cannot explain its decline.
First, look at the confirmed selling pressure. Over the full 4-hour period from 04:00 to 08:00, MARSCOIN fell from 0.0645 to 0.0534, a single-period decline of 17.21%, with trading volume of about 5.6866 million USDT—7.57 times the median for the previous 12 full 4-hour periods. From 08:00 to 12:00, it continued lower to 0.0493 on 4.17 times the median volume, closing at 0.0529. These two periods show that the decline was not a low-volume drift: aggressive selling and a liquidity shock were both present.
Next, consider the change at the margin. From 12:00 to 16:00, trading volume over the full 4-hour period fell to 1.05 times the median, while the price moved from a close of 0.0529 to 0.0524. In the latest full hour, from 16:00 to 17:00, it closed at 0.0520, down from 0.0524, on just 158,300 USDT in volume—0.56 times the median for the previous 24 hours. Selling pressure has eased, but the snapshot price of 0.0515 is only 4.46% above the intraday low of 0.0493; low volume does not automatically mean a rebound.
As for the cause, Binance’s September 4 listing announcement explicitly described MARSCOIN as a meme token on BNB Chain and assigned it a Seed Tag, warning that its volatility and risk are higher than those of conventional assets. The project’s website currently shows about $1.2 million in on-chain liquidity and a 3% tax on both buys and sells. However, these are details about the on-chain market; they cannot be treated as a direct measure of Binance spot order-book depth, nor can they explain today’s concentrated selling pressure. I found no verifiable project-specific incident or negative announcement from October 30, so the claim that “the project suddenly imploded” remains unsubstantiated.
From here, watch for just three possible outcomes:
Further deterioration: A full 1-hour candle closes below 0.0493 on increased volume, with trading volume rising back above about 282,400 USDT. This would indicate that active selling has confirmed a break of the low.
Consolidation near the lows: The price stays between 0.0493 and 0.0541 while volume continues to decline. This would indicate that panic selling is easing, but would not yet qualify as a trend reversal.
Recovery begins: A full 1-hour candle closes back above 0.0541 on increased volume, followed by a full 4-hour candle reclaiming 0.0645. That would first recover the local structure, then invalidate the concentrated selloff. If it holds above 0.0645 on strong 4-hour volume, the view that “the decline remains driven by selling pressure” would no longer hold.
The main risks are the volatility and slippage of a Seed Tag asset, differences in depth between on-chain and centralized markets, fluctuations in candles that have not yet closed, and mistaking a low-volume pause in the decline for a return of buyers. First, open the core trading pair page and check the latest completed hourly volume, then see which side—0.0493 or 0.0541—gets confirmed at the close. Only when price and volume both turn will a rebound move from speculation to a verifiable setup.