🚨 $AIN IS SHOWING EXTREME WHALE ACTIVITY! 🐳 | BULLISH CONTINUATION OR A MASSIVE TRAP?
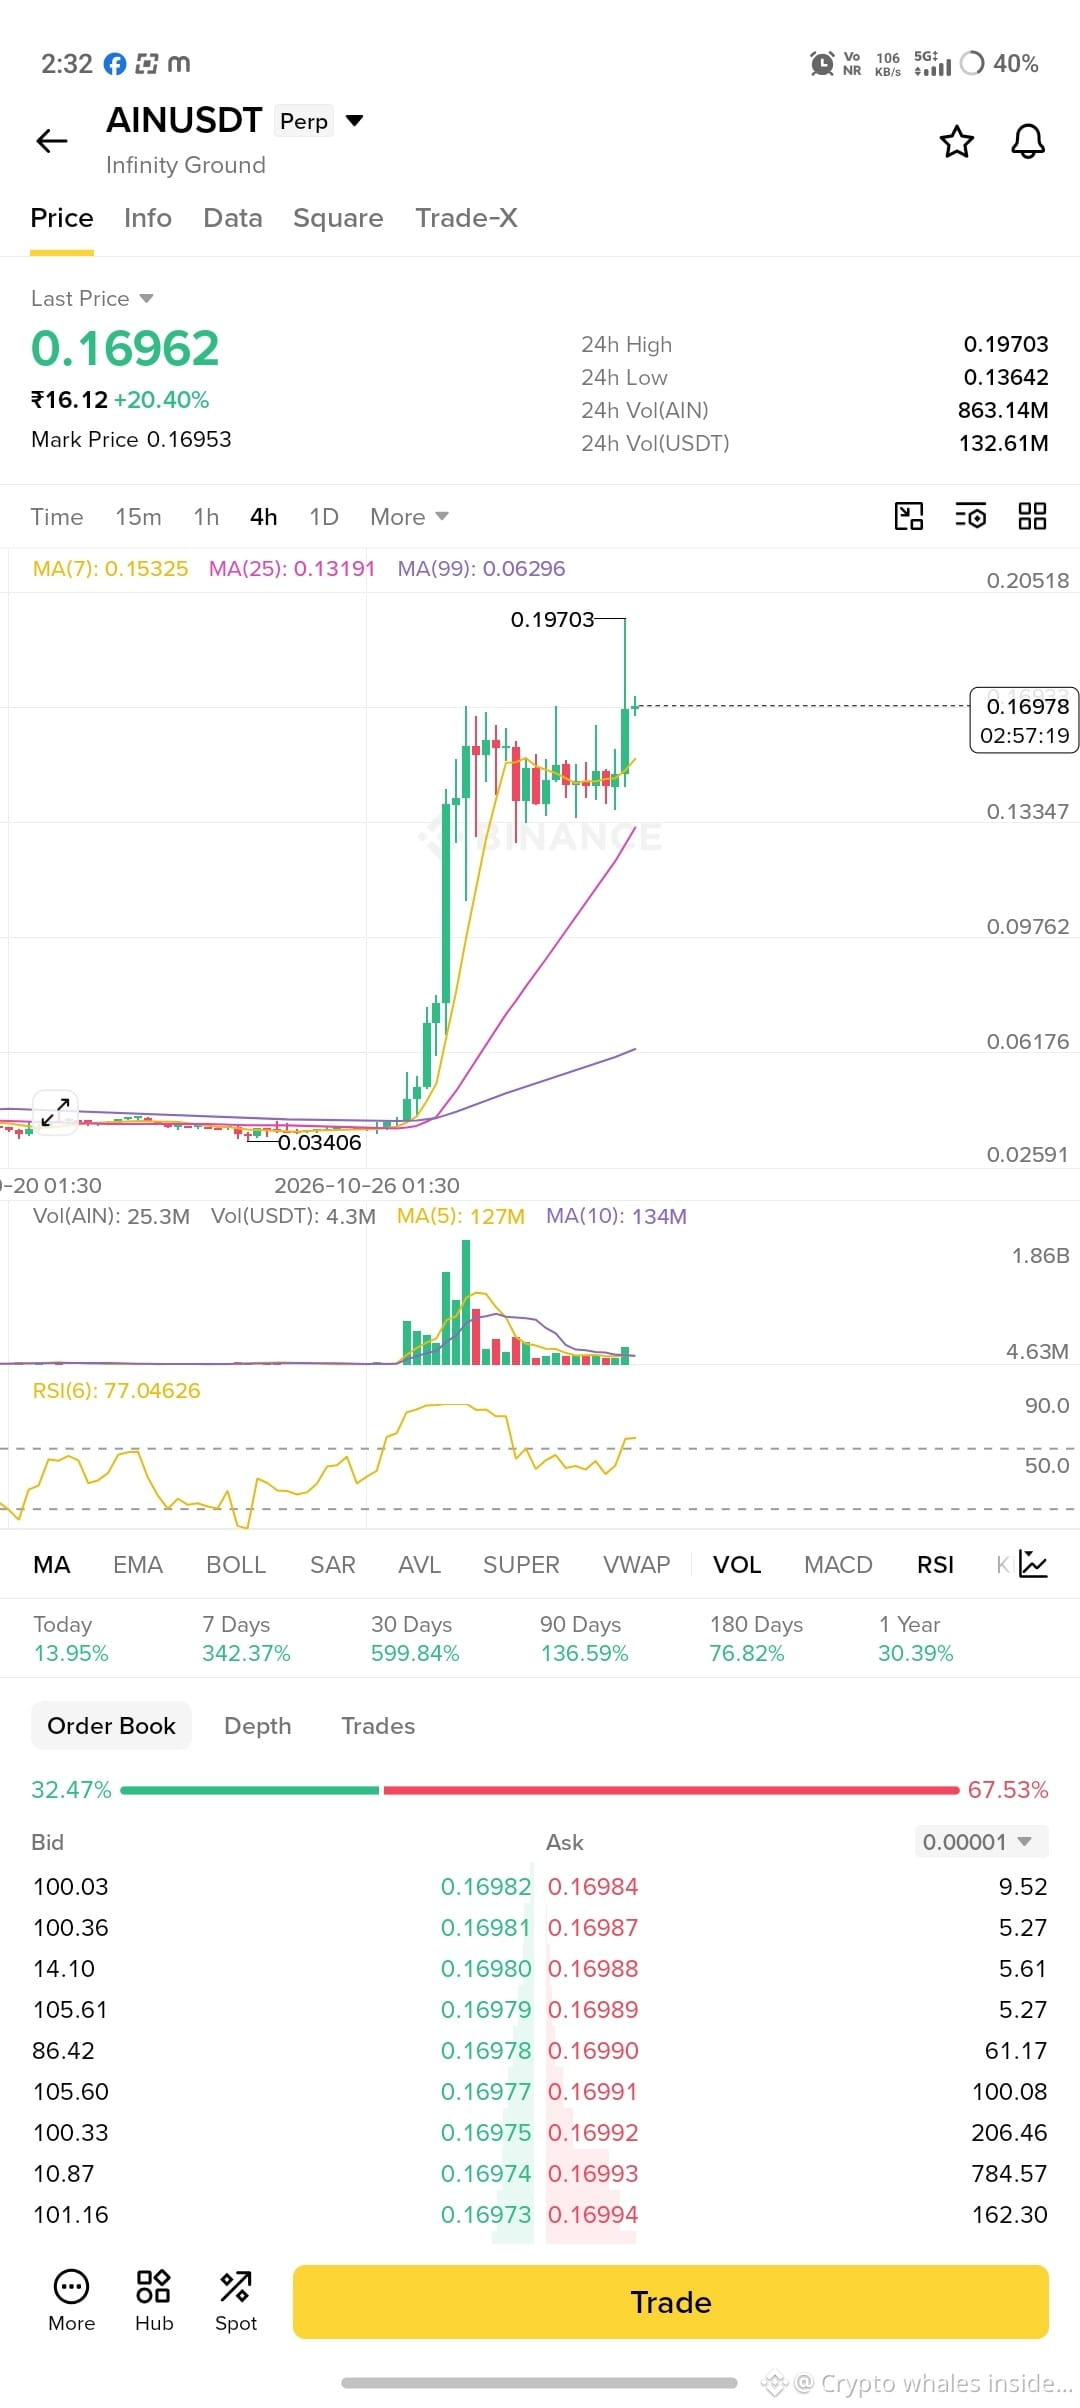
$AIN has delivered an explosive rally, moving from approximately $0.034 to $0.197, gaining nearly 478% from its recent low.
But what are whales and derivatives data telling us about the NEXT MOVE?
Let's break it down. 👇
🐳 1. WHALE POSITIONING
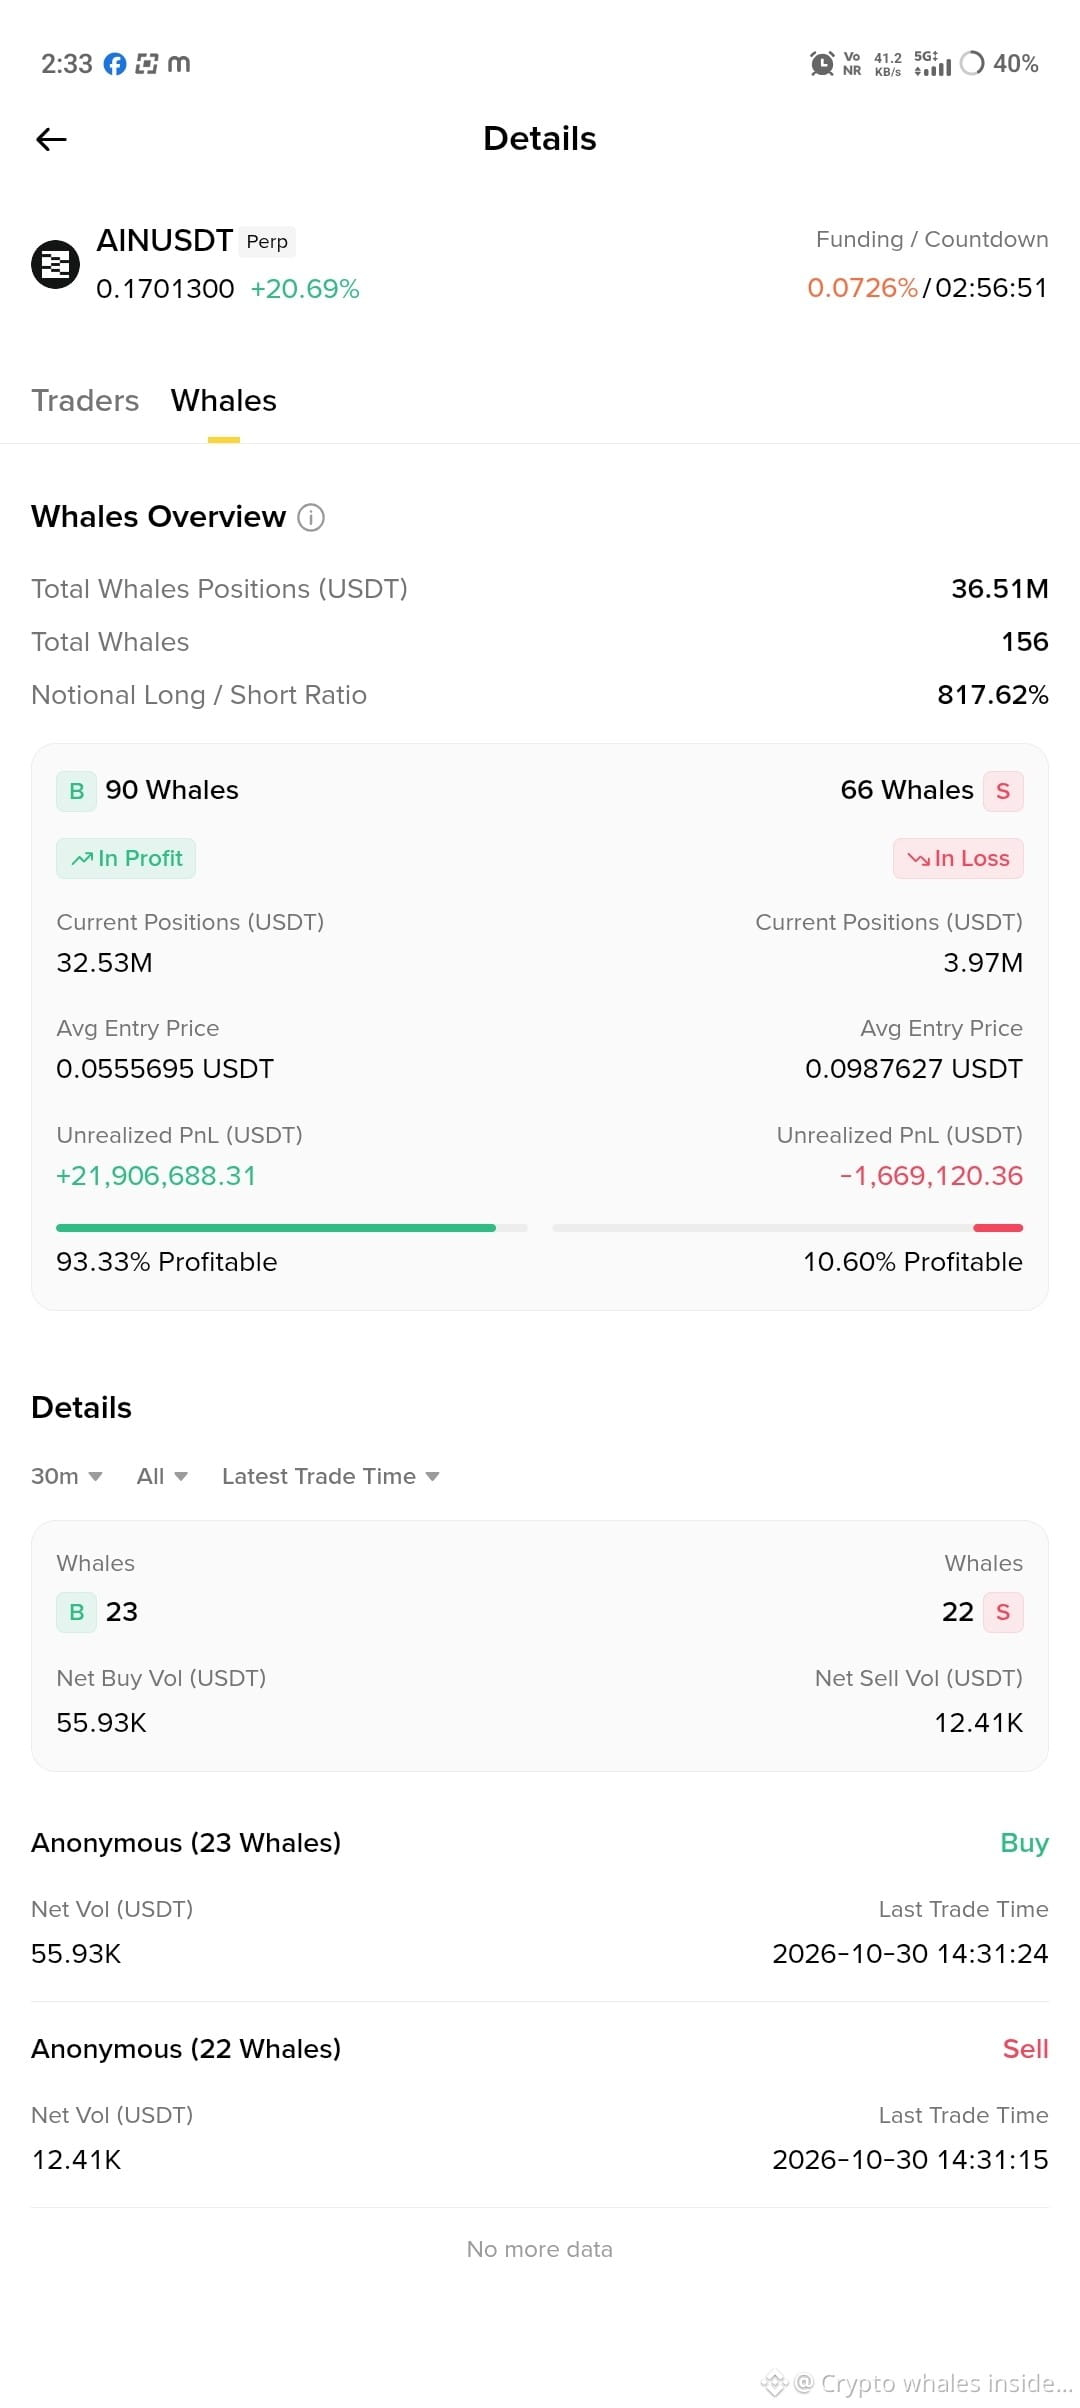
• Total whale positions: $36.51M
• Total whales: 156
• Long positions: $32.53M
• Short positions: $3.97M
• Long/Short notional ratio: 817.62%
90 whales are holding longs, while 66 whales are holding shorts.
Long whales have an average entry of $0.05556 and are sitting on approximately $21.9M unrealized profit.
Meanwhile, short whales are facing approximately $1.67M in unrealized losses.
This indicates extremely crowded bullish positioning.
📊 2. RECENT WHALE ACTIVITY
Last 30-minute snapshot:
🟢 Whale buying: $55.93K
🔴 Whale selling: $12.41K
Net buying: $43.52K.
Buy-side activity is currently stronger, but we need to monitor whether this continues.
📈 3. TECHNICAL INDICATORS
Current price: $0.1696
4H indicators:
• MA7: $0.15325
• MA25: $0.13191
• MA99: $0.06296
• RSI(6): 77.05
Price remains above all three moving averages, indicating a strong bullish trend.
However, RSI above 70 signals overheated momentum. Profit booking and consolidation are possible.
💸 4. FUNDING RATE
Current funding: +0.0726%
Positive funding indicates that longs are paying shorts.
With crowded long positioning, a sudden reversal could trigger long liquidations.
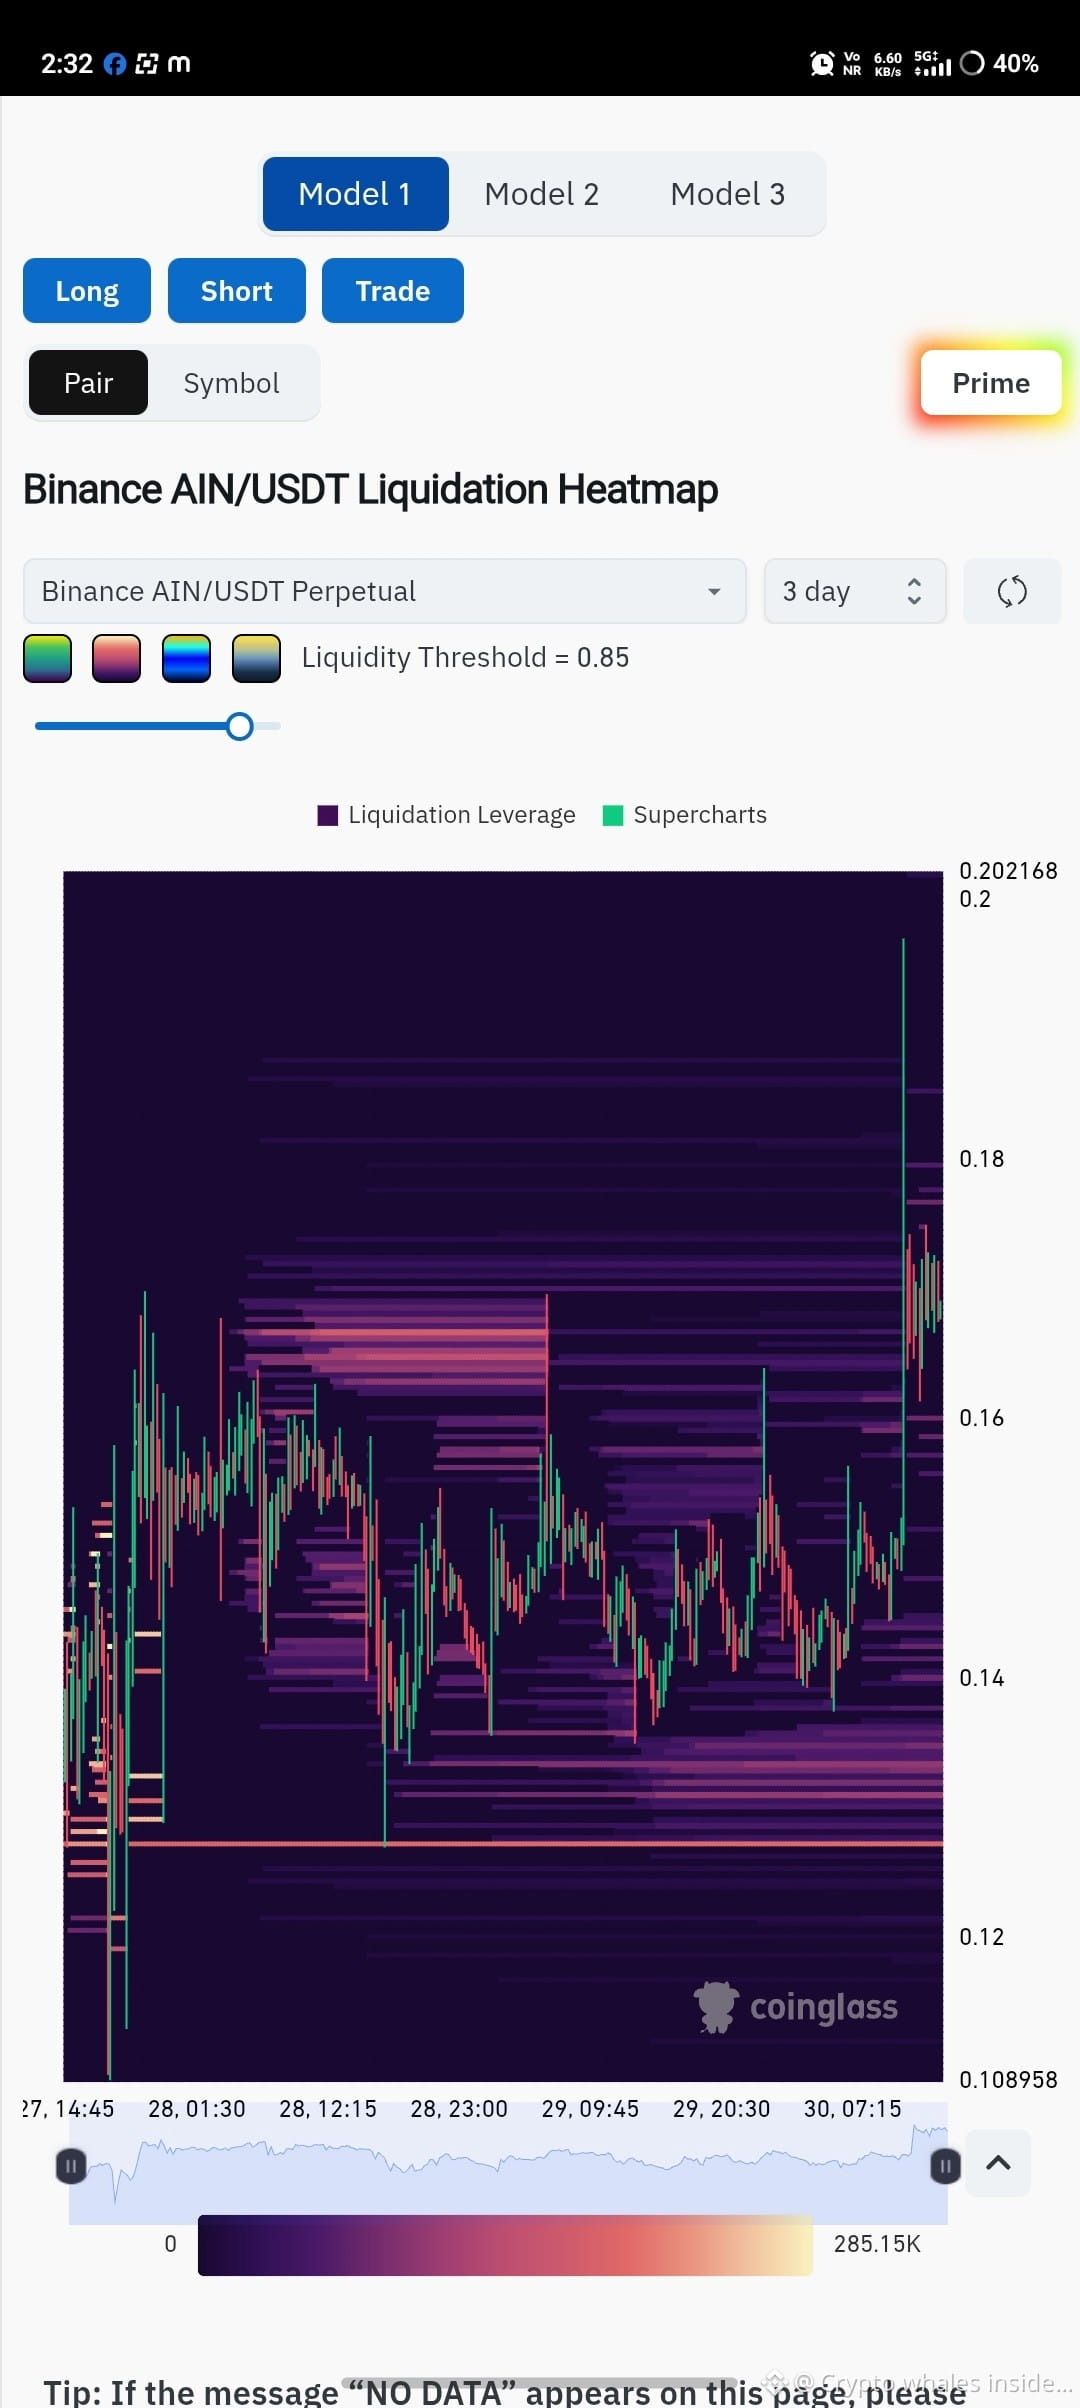
🔥 5. LIQUIDATION HEATMAP
Important liquidity zones to monitor:
• $0.175–$0.180: Near-term upside liquidity
• $0.185–$0.190: Higher upside liquidity
• $0.160–$0.165: Potential downside liquidity
• $0.150–$0.153: Important support area
• $0.130–$0.135: Deeper downside zone
These are potential liquidity magnets, not guaranteed targets.
🎯 6. WHAT IS THE NEXT MOVE?
#AIN #InfinityGround #AINUSDT #Binance #CryptoAnalysis #WhaleActivity #Altcoins #LiquidationHeatmap #CryptoTrading