*$BNB - Short Analysis - 29 Oct 2026*
*Current: $749.80 | -0.1% today | Range $743 - $762*
Market cap $98.5B (#4). 45% below ATH of $1,369.
*Technical:*
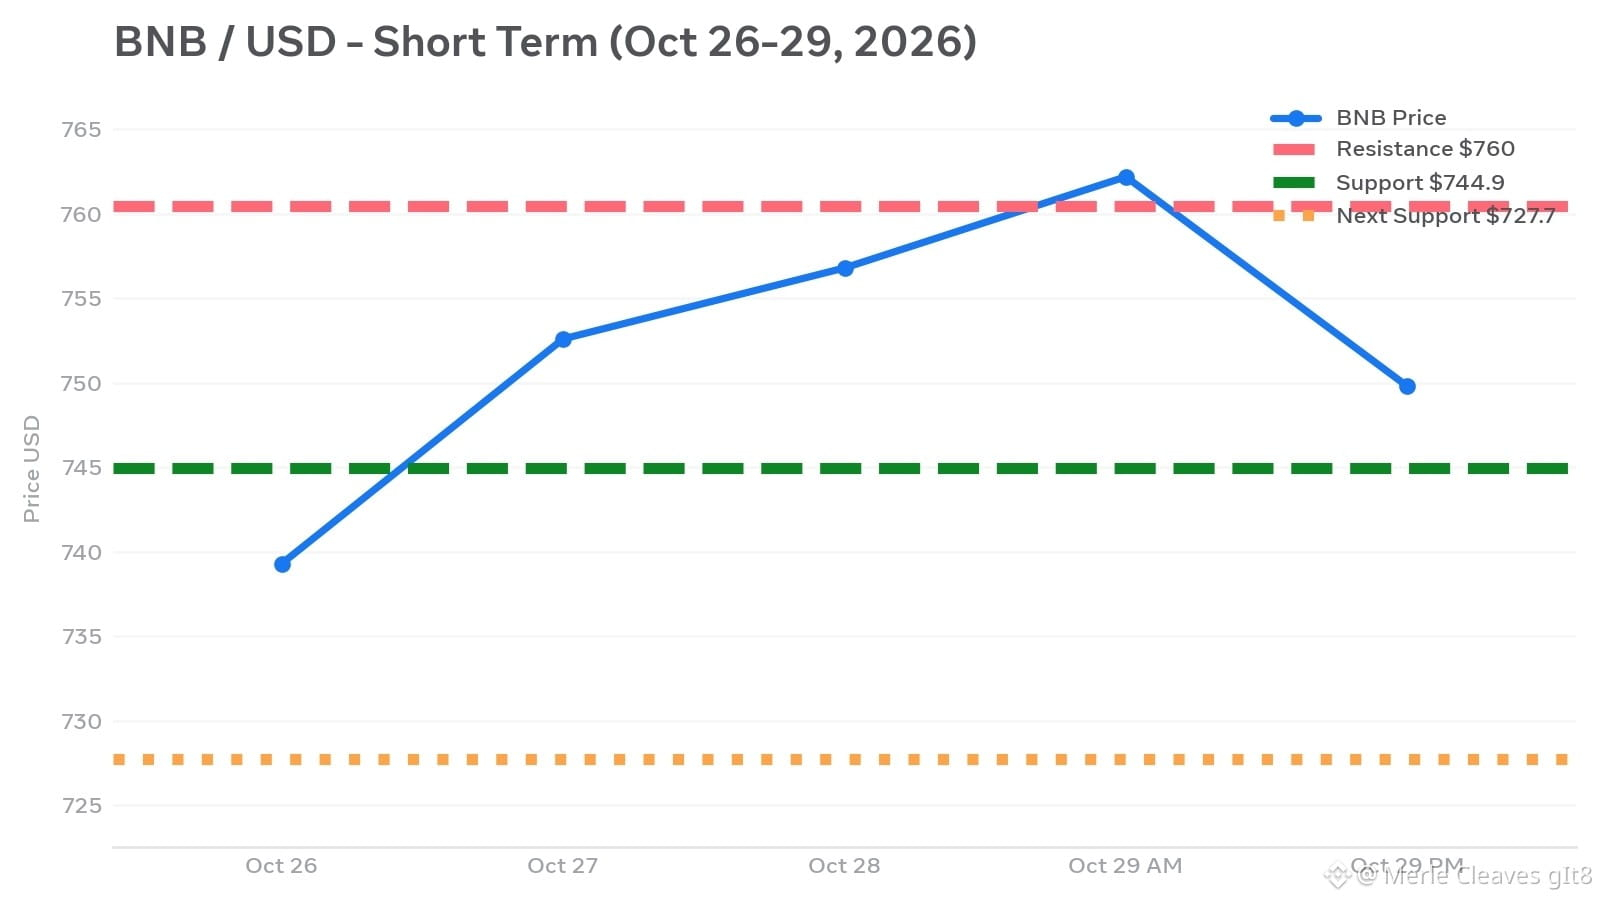
- *Structure:* BNB rose from $739 to $762 between Oct 27-29; it is now facing double rejection at $760. This is also the $760.44 Bollinger Upper Band.
- *Indicators:*
- RSI 53.9 (Neutral), Stochastic %K 82.9 (overbought) - signal of a slight pullback
- Price is above all SMAs: 7D $745.5, 20D $738.6, 200D $654.5
- ATR $17.4, meaning it could reach $744 or $761 in a day
- *Futures Data:* 72% of accounts are long, but the taker sell ratio is 0.69 and OI is down 2.7%, meaning positions are long-heavy but selling pressure is present feb0
*Key Levels:*
- Resistance: *$760 - $769*
- Support: *$744.98, then $727.74*
- A daily close > $759.92 with volume is needed for a breakout, with targets at $795 / $821
*Fundamentals:*
- 37th burn on 19 Oct: 1.64M BNB ($1.19B) burned; supply is now 131.5M
- Jenner upgrade live on testnet: Payment Lane (5% of gas reserved for payments)
- Q3 revenue +54% = $54.2M, transactions 1.51B
*Short Bias:* Consolidation. If $744 holds, a re-test of $760; if it breaks, $727.
Not financial advice - for information only. Do you hold BNB spot?
#EarningsSeason #USMidtermElections #BinanceWillListPredictPREDICT #TwoAddressesHoldingAbout1.28BUSDTFrozen
*Current: $749.80 | -0.1% today | Range $743 - $762*
Market cap $98.5B (#4). 45% below ATH of $1,369.
*Technical:*
- *Structure:* BNB rose from $739 to $762 between Oct 27-29; it is now facing double rejection at $760. This is also the $760.44 Bollinger Upper Band.
- *Indicators:*
- RSI 53.9 (Neutral), Stochastic %K 82.9 (overbought) - signal of a slight pullback
- Price is above all SMAs: 7D $745.5, 20D $738.6, 200D $654.5
- ATR $17.4, meaning it could reach $744 or $761 in a day
- *Futures Data:* 72% of accounts are long, but the taker sell ratio is 0.69 and OI is down 2.7%, meaning positions are long-heavy but selling pressure is present feb0
*Key Levels:*
- Resistance: *$760 - $769*
- Support: *$744.98, then $727.74*
- A daily close > $759.92 with volume is needed for a breakout, with targets at $795 / $821
*Fundamentals:*
- 37th burn on 19 Oct: 1.64M BNB ($1.19B) burned; supply is now 131.5M
- Jenner upgrade live on testnet: Payment Lane (5% of gas reserved for payments)
- Q3 revenue +54% = $54.2M, transactions 1.51B
*Short Bias:* Consolidation. If $744 holds, a re-test of $760; if it breaks, $727.
Not financial advice - for information only. Do you hold BNB spot?
#EarningsSeason #USMidtermElections #BinanceWillListPredictPREDICT #TwoAddressesHoldingAbout1.28BUSDTFrozen