


🐰 BUNNY, HOW ARE YOU DOING OVER THERE? IS $100 000 STILL A LONG WAY OFF? 😂🚀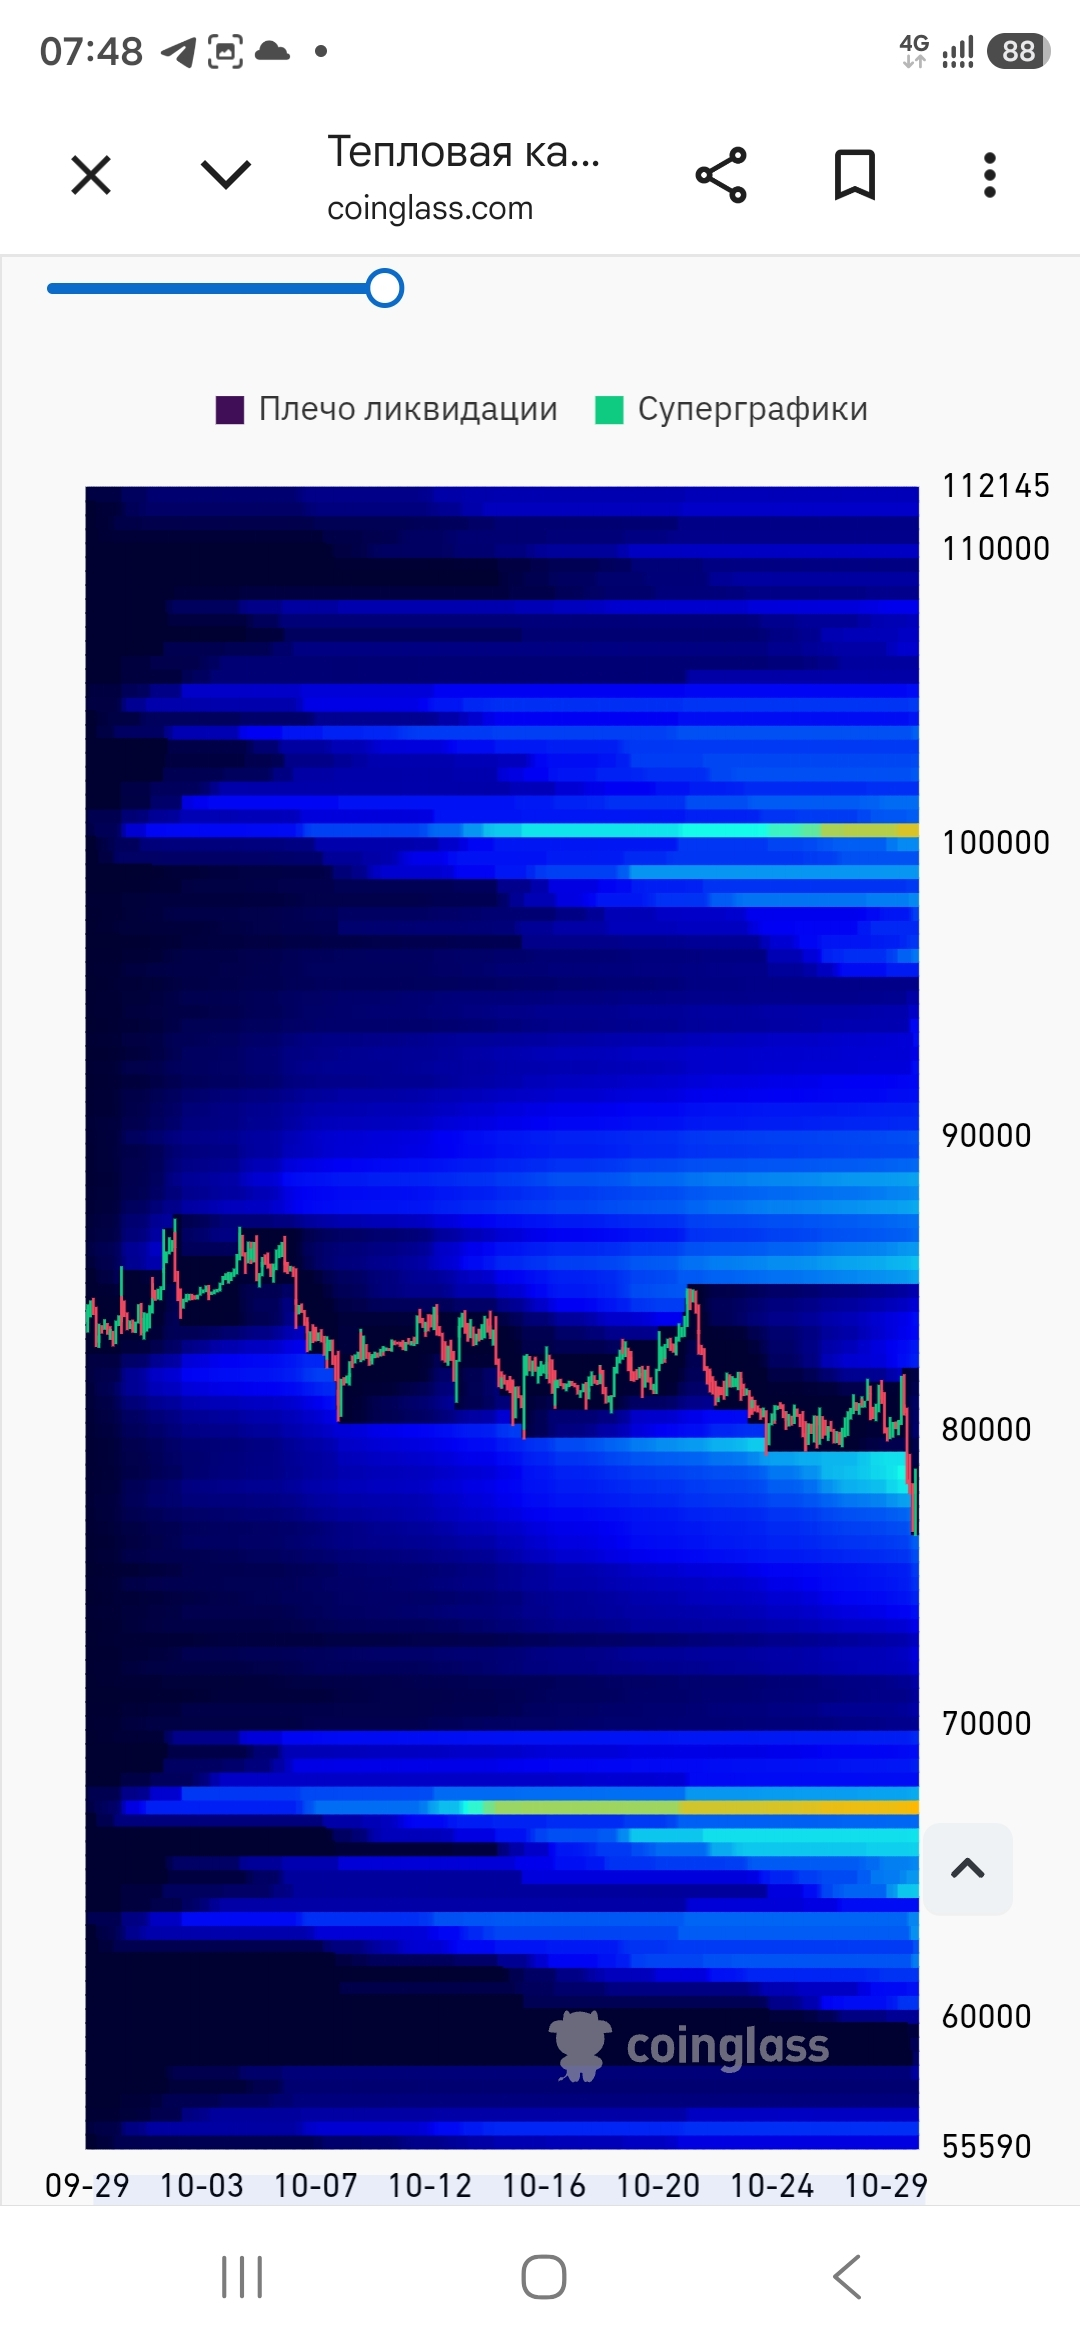
Now take a look at CoinGlass’s monthly Bitcoin liquidation heatmap!
Here's what's interesting:
🟢 $100 000 — a bright band of liquidity is glowing above. That’s the coveted target our little bunny is pulling Bitcoin toward with all its might!
🔴 $67 000–68 000 — another powerful liquidation zone is sitting below.
And BTC itself had already plunged to $76,500.
So here I am, staring at this chart and thinking:
Our little bunny is quite the optimist! It’s pulling Bitcoin toward $100,000, while the market seems to have decided to test its resilience first. 😂
But seriously, the chart shows an interesting picture.
Above are large clusters of short liquidations; below, long liquidations. And the lower zone is now much closer to the price.
⚠️ However, the bright bands don’t mean Bitcoin will necessarily reach those levels. They’re potential liquidation zones, not a ready-made forecast.
This is where trading psychology comes in.
We see the risk of a drop, but our hearts have been set on $100,000 for ages!
Bunny, just don’t let go of the rope! 🐰❤️
And I’d like to ask the market: how much longer are you going to test buyers’ patience?
💬 What do you think Bitcoin will hit first — $68,000 or $100,000?
#Bitcoin #BTC #CoinGlass #LiquidationHeatmap #Bitcoin100K #TradingPsychology #BinanceSquare #AURAMEUM