


On October 30, the BNB market was hit by sudden, sharp volatility! According to the candlestick chart, BNB had been trading sideways between $740 and $760, but today it faced heavy selling, briefly dropping to a low of $677.76 before rebounding quickly. It is currently trading around $709.45.
The most notable thing about this move isn’t how far the price fell, but that it broke below the previous trading range in a short time, directly disrupting the existing short-term structure.
Taking the daily, four-hour, and one-hour charts together, bears still have the upper hand. Although some buying support emerged around $677 and the price may be due for an oversold rebound, it has yet to reclaim the moving averages. For now, this rebound shouldn’t be treated as a trend reversal.
My key view is this: In the short term, watch whether the rebound can hold above $720. If it lacks momentum, continue to watch support at $700 and $680. The current strategy favors shorting rebounds rather than blindly buying the dip.
I. Daily Analysis: Rebound Structure Damaged, $700 Becomes a Key Line of Defense
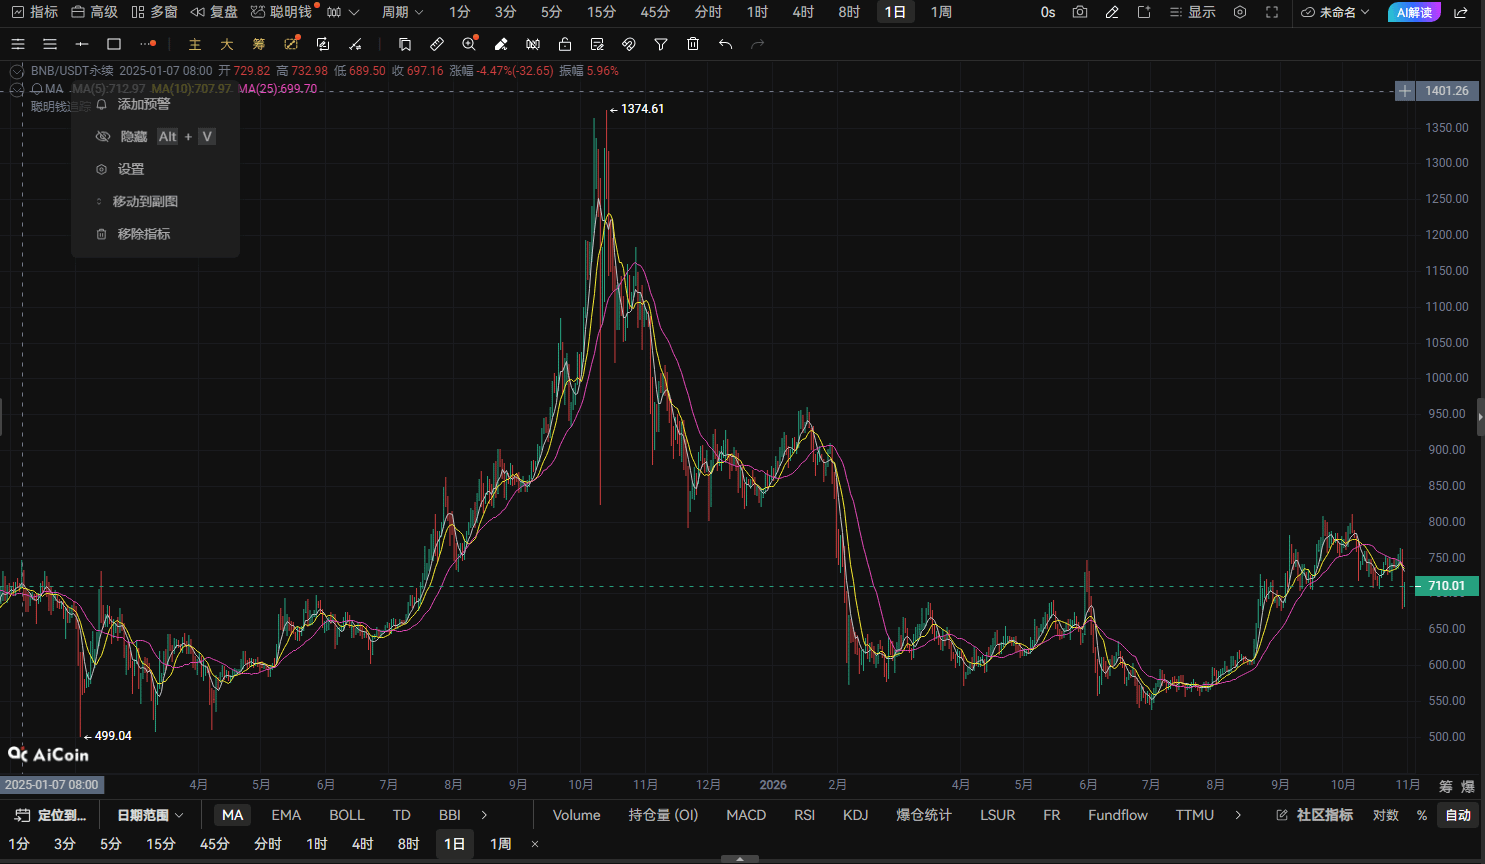
On the daily chart, BNB gradually climbed from around $550, rebounding to a high above $800 and completing a fairly clear recovery move overall.
However, since entering October, the price has been rejected several times in the $780–$800 range and has gradually retreated. Today's sharp downward candle has dealt a significant blow to the previous rebound structure.
The price is now back around $709, with the $700 area serving as a key support zone to watch in the short term.
If BNB can hold $700 and reclaim levels above $720, the daily chart may still have room to recover further, with $730 and around $750 as upside levels to watch.
But if $700 breaks decisively, it would indicate insufficient buying support, and the price could retreat further to $690 or even retest the lows around $680.
Daily outlook: The medium-term uptrend is under clear pressure, and the short-term bias is bearish. To regain strength, the price needs to reclaim at least $730; otherwise, rebounds should be treated with caution.
II. Four-Hour Analysis: Bears Suddenly Take Control, Moving Averages Form Clear Resistance
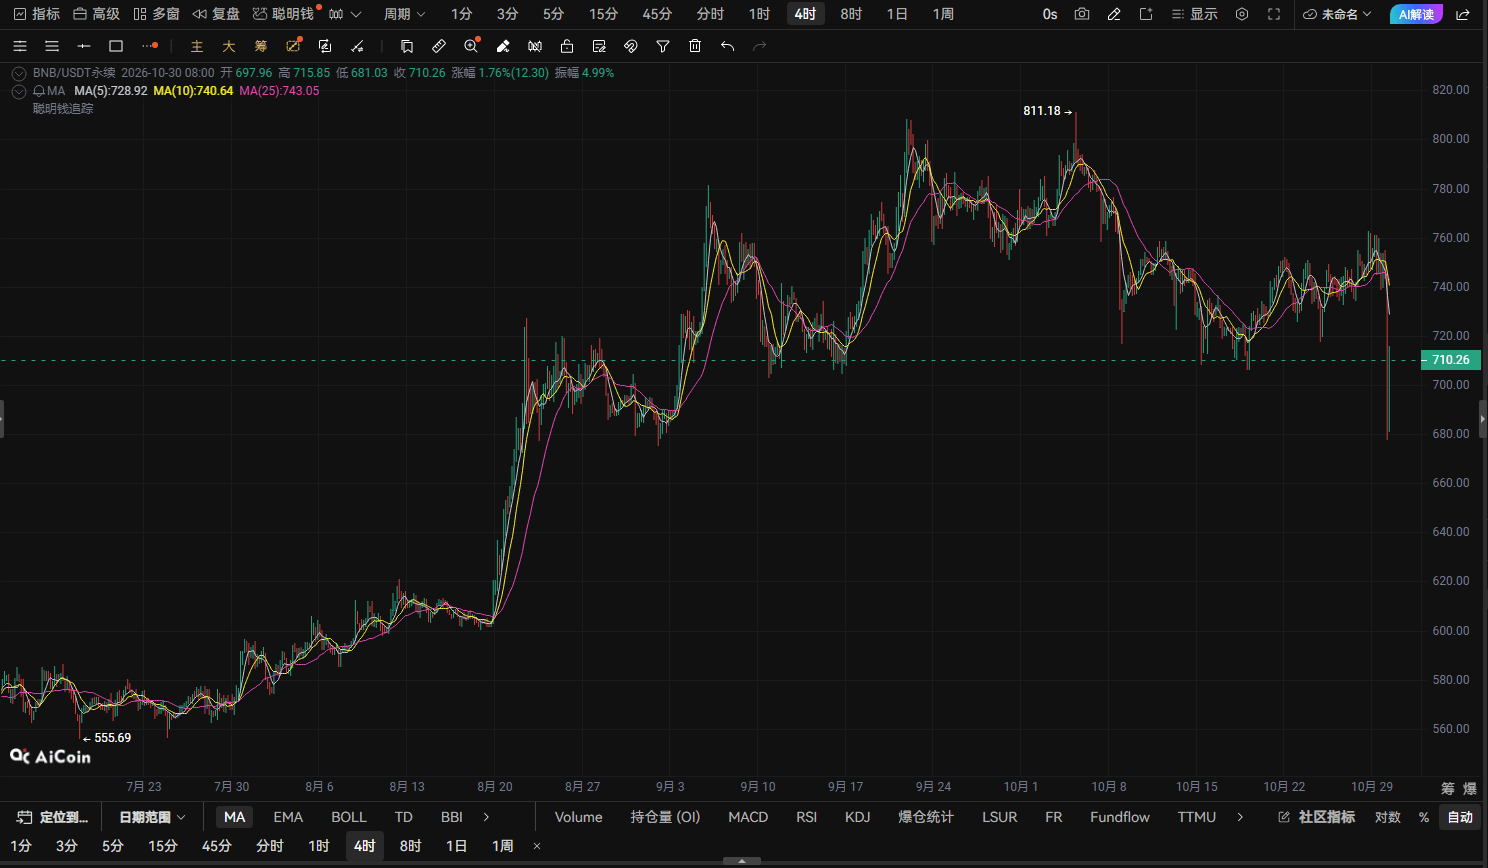
The four-hour chart is the most important part to focus on today.
Previously, BNB mainly traded sideways between $720 and $760. Around October 29, it even attempted to push higher, but the price then suddenly plunged, hitting a low of $677.76.
This decline broke straight through the previous trading range, indicating that bearish pressure has increased significantly and short-term market sentiment has shifted.
Looking at the moving averages, the four-hour MA5 is around $728.92, the MA10 around $740.64, and the MA25 around $743.05.
At the current price of $709.45, BNB is well below all three moving averages, meaning the $730–$745 area above has become a strong resistance zone.
If the price rebounds to around $720–$730 and meets resistance, bears may regain momentum, creating an opportunity for the price to fall back and test $700.
If the rebound is strong and the price can hold above $745 again, the short-term downtrend structure may begin to repair.
Four-hour outlook: Bears have the upper hand, and for now the rebound is best viewed as a technical recovery after the decline. The $730–$745 area is an important resistance zone; avoid chasing longs before it is decisively reclaimed.
III. One-Hour Analysis: An Oversold Bounce Has Begun, but the Trend Has Not Truly Turned Bullish
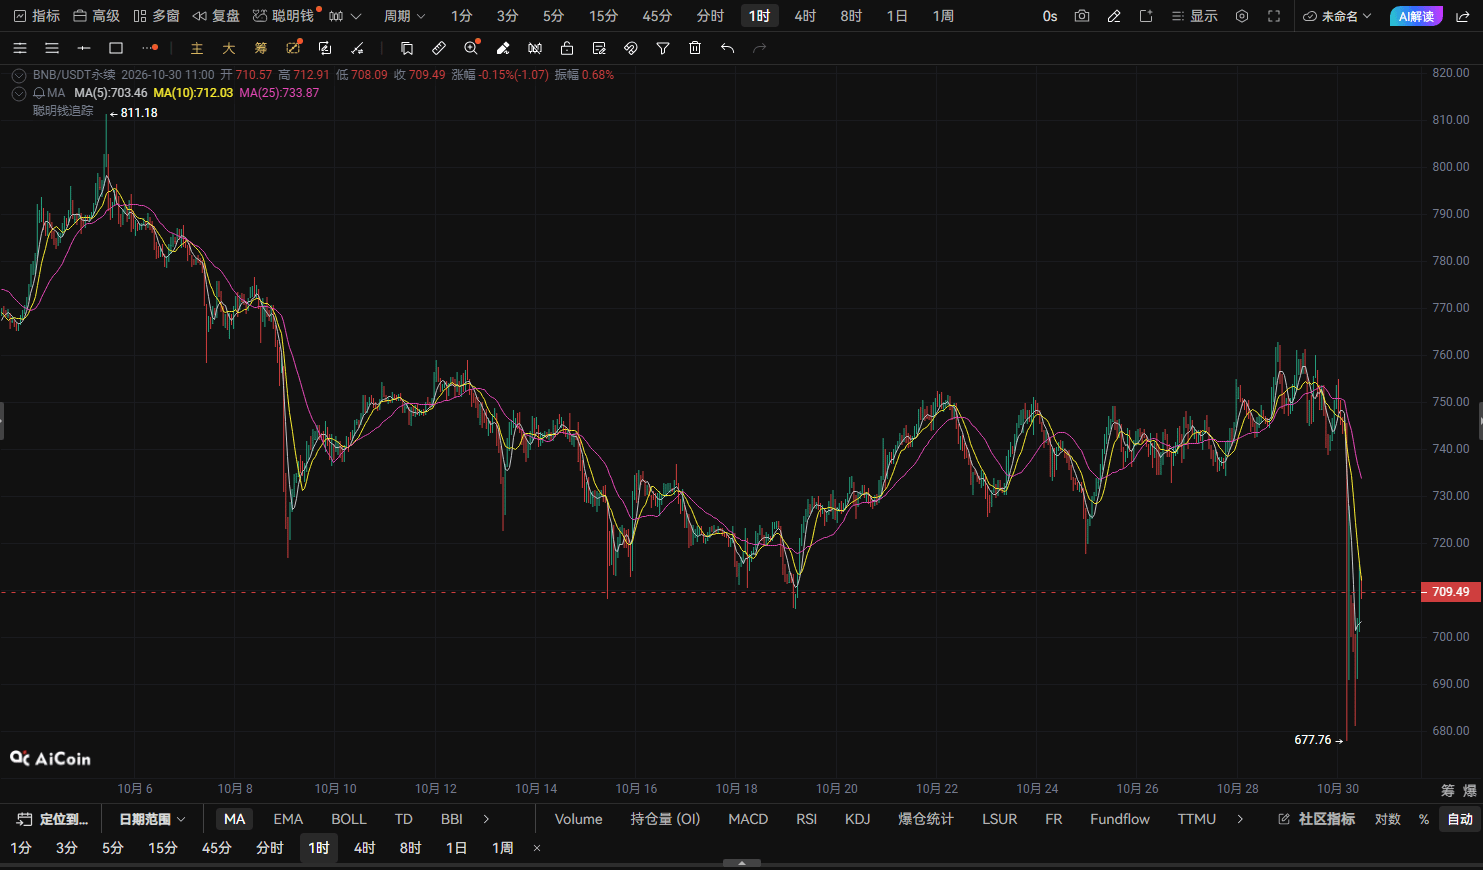
The one-hour chart gives a clearer picture.
According to the candlestick chart, BNB fell rapidly from around $750, hitting a low of $677.76 before rebounding noticeably. It is now back around $709.45.
Looking at the moving averages, the one-hour MA5 is around $703.46, the MA10 around $712.03, and the MA25 around $733.87.
Although the price has climbed back above the MA5, it remains under pressure from the MA10 and MA25.
This shows that buyers have indeed stepped in to provide short-term support, but the rebound has not yet formed a complete bullish moving-average alignment.
Watch these three levels next:
$700: The first short-term support level. If it holds, the price may continue to rebound.
$712–$720: The first short-term resistance zone. If the price cannot break through decisively, the rebound may end again.
$730–$734: An important one-hour moving-average resistance zone. Only if the price can hold above this area on strong volume may the short-term trend have a chance to strengthen further.
One-hour outlook: A short-term rebound is possible, but its strength is not yet enough to change the broader bearish bias. Avoid blindly chasing the price higher for now, and focus on how it behaves around $712–$720.
IV. October 30 Trading Strategy: Favor short positions on rebounds facing resistance; watch for accelerated downside if $700 breaks
Across the three timeframes, the daily rebound structure has weakened, the four-hour moving averages are acting as resistance, and although the one-hour chart has rebounded, a trend reversal has not yet been confirmed.
Therefore, my trading bias today is bearish.
If the price rebounds to around $712–$720 but fails to hold there, bears may still have a chance to regain control.
First watch $700 on the downside, followed by around $690 and $680.
Of course, if BNB quickly reclaims $720 and then breaks above $730, be alert to a rebound driven by short covering, and don't stubbornly stick to short positions.
My view: The market is often most dangerous not during a decline itself, but afterward, when people are led to believe the bottom is in. Although a rebound occurred near $677, there is not yet enough evidence to confirm that a bottom has formed. Respect the trend when trading, and don't fight the market.
V. Live Trading Plan
BNB/USDT: Open a short position at the current price of $709.45.
Direction: Short
Entry price: $709.45
Stop-loss price: $723.64
First take-profit: $702.36
Second take-profit: $688.17
Execution reminder: Once the first take-profit level is reached, consider reducing the position appropriately and protect the remaining position. If the price breaks above $720 decisively and holds there, be alert to a continued rebound. Volatility is high, so be sure to control position size and strictly follow the stop-loss.