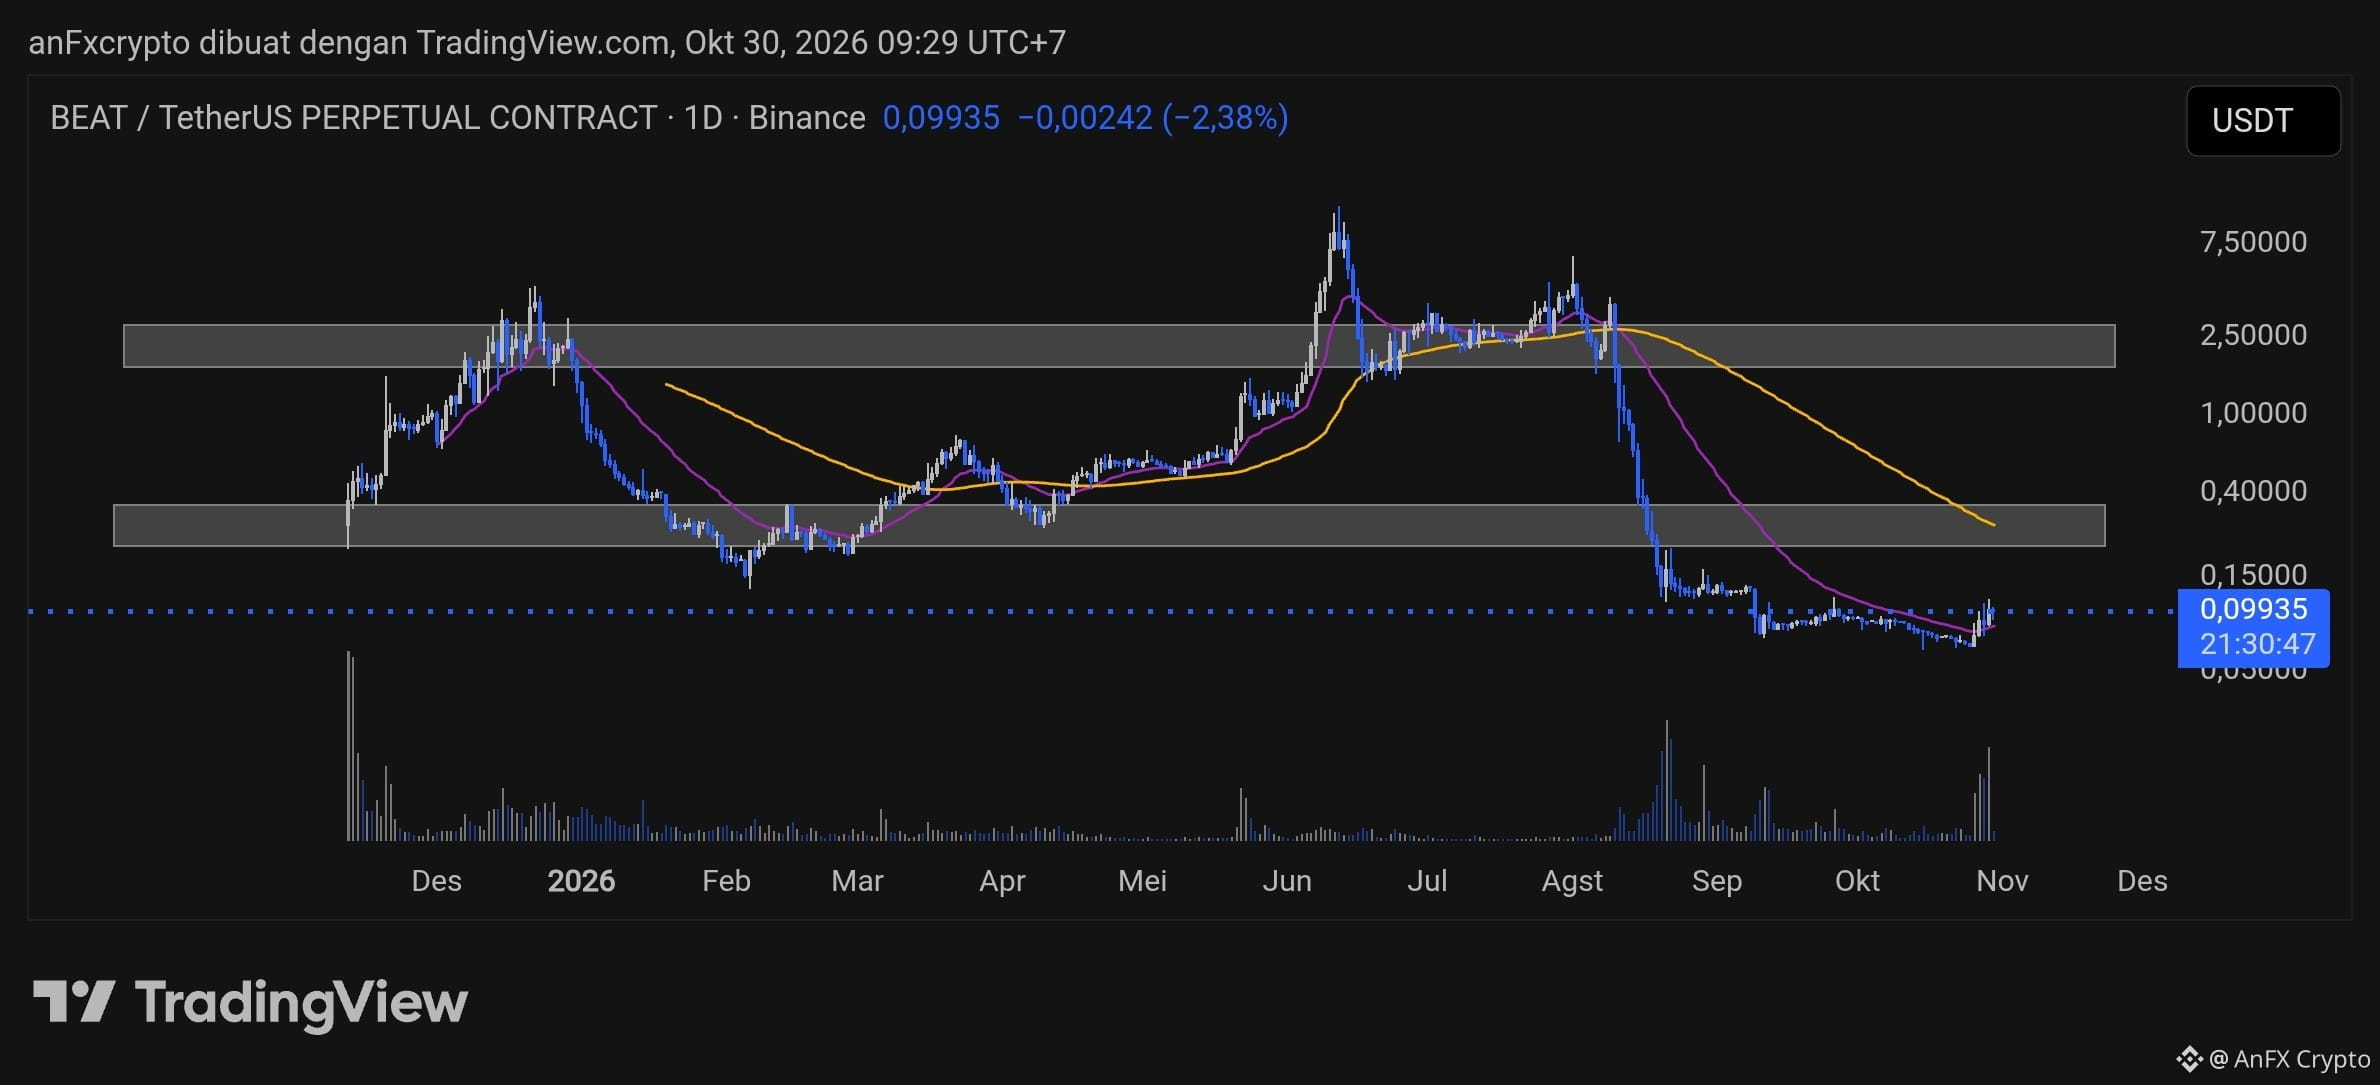
Technical Analysis: $BEAT /USDT.P (1D)
Based on the daily (1D) chart for the BEAT/USDT Perpetual pair on Binance as of October 30, 2026:
1. Market Structure & Price Action
Main Trend (Macro Trend): STRONGLY BEARISH. After a sharp spike to the $7.50+ area in the middle of the year, the price suffered a massive dump and entered a prolonged downtrend (a structure of lower highs and lower lows).
Critical Support Zone: The price is currently around $0.099, approaching the all-time low / lower liquidity boundary of the psychological $0.065–$0.080 area. There are signs of consolidation and small volumes beginning to enter at the bottom, indicating the potential for an accumulation phase or a dead cat bounce.
Nearest Resistance Zones:
Resistance 1: $0.150–$0.200 (the lower boundary of the previous consolidation box).
Resistance 2: $0.400–$1.000 (the area of the declining Moving Average/MA lines).
2. Trading Plan & Signals (High Risk / Speculative Play)
Given this asset’s extreme volatility and the macro trend’s continued bearishness, this setup is classified as a High-Risk Speculative Reversal / Mean Reversion Long.
Action Setup (Long Position):
Entry / Buy Zone: Accumulate gradually in the $0.085–$0.100 range (make sure there is confirmation from a daily candle bounce or a support retest).
Take Profit (TP):
TP 1: $0.150 (potential gain of ~50%)
TP 2: $0.250 (next target if there is a high-volume breakout)
Stop Loss (SL): Daily candle closes below $0.065 (invalidates the lower support structure).
3. Professional Risk Management
Leverage: Maximum 1x–2x (or spot trading), given the high liquidation risk associated with highly volatile assets.
Position Sizing: Use only a small amount of capital (a maximum of 1%–2% of total portfolio risk), because the long-term trend (1 month / 3 months) still shows massive selling pressure.