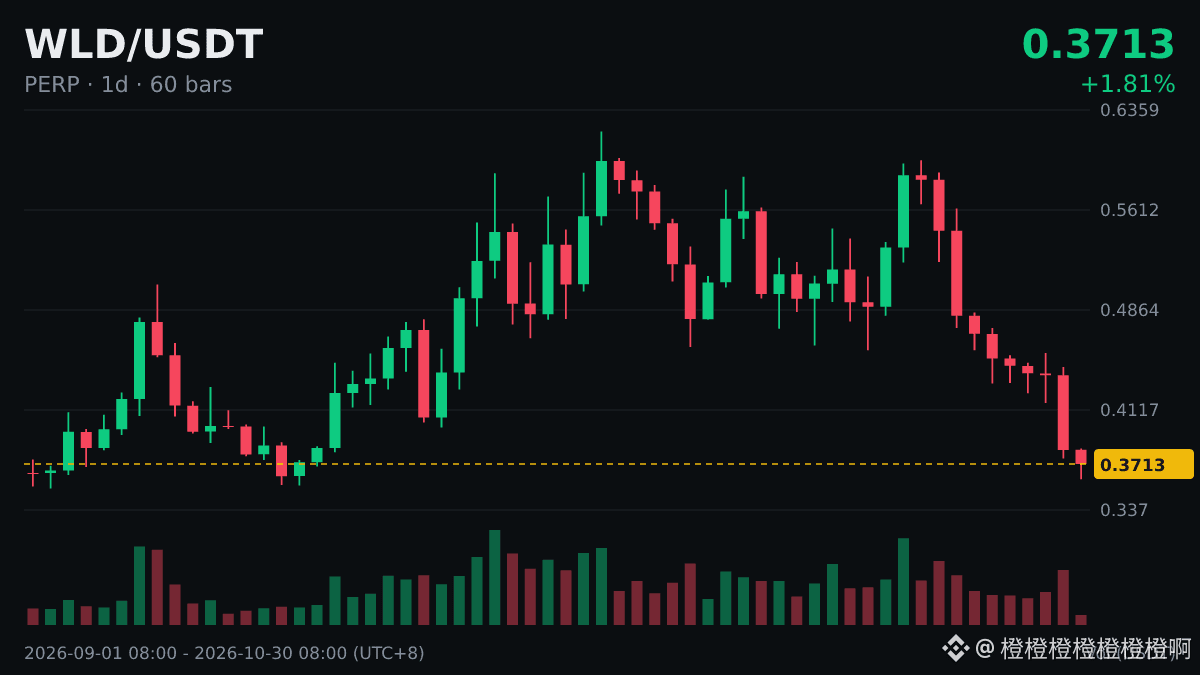
$WLD The daily chart has seen 9 consecutive down candles, for a cumulative decline of -34.96% during that period. So far today, it's down -2.72%.
Let's use this data to talk about consecutive down days on the daily chart.
A series of candles of the same color indicates that buyers or sellers have been in control throughout that period. The candlestick chart suggests a fairly clear directional trend.
Some people look at the daily and weekly charts together: when the weekly trend points in the same direction, consecutive up or down days on the daily chart are often more likely to continue for a while; when the directions don't align, it's worth being more cautious.
Don't place an order during the sharpest swing. Wait for the price to settle before taking a closer look.
#WLD
This is just my personal opinion—take it for what it's worth, not as advice.