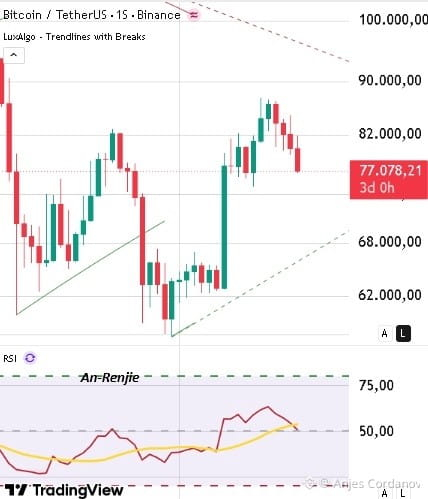
68K IS ON THE TABLE.
Bismilahi Rahmani rahim...
Look what I see on the 1W chart
1. The first ascending support has broken:
The indicator’s green line that held from the 60k lows, the one from 2024, has now been lost with the large red candle. That leaves it without immediate support.
2. It’s now testing the second one:
The dotted green line coming up from the 56k–58k low is right at 68k–69k. If the week closes below 75k, as it is now at 77.078, the next magnet is that line.
3. Weekly RSI:
It’s at 53–54 and falling, crossing below the yellow line. It’s not oversold; there’s room to fall to 40. That gives it fuel to go to 68k. Could it get there?
Yes. If it loses 74k–75k on a weekly close, the path is clear:
72k -> 68k -> 62k
Follow me for more financial lessons.
Visit me on X: @AnjesCordanov
$BTC $ETH $SOL