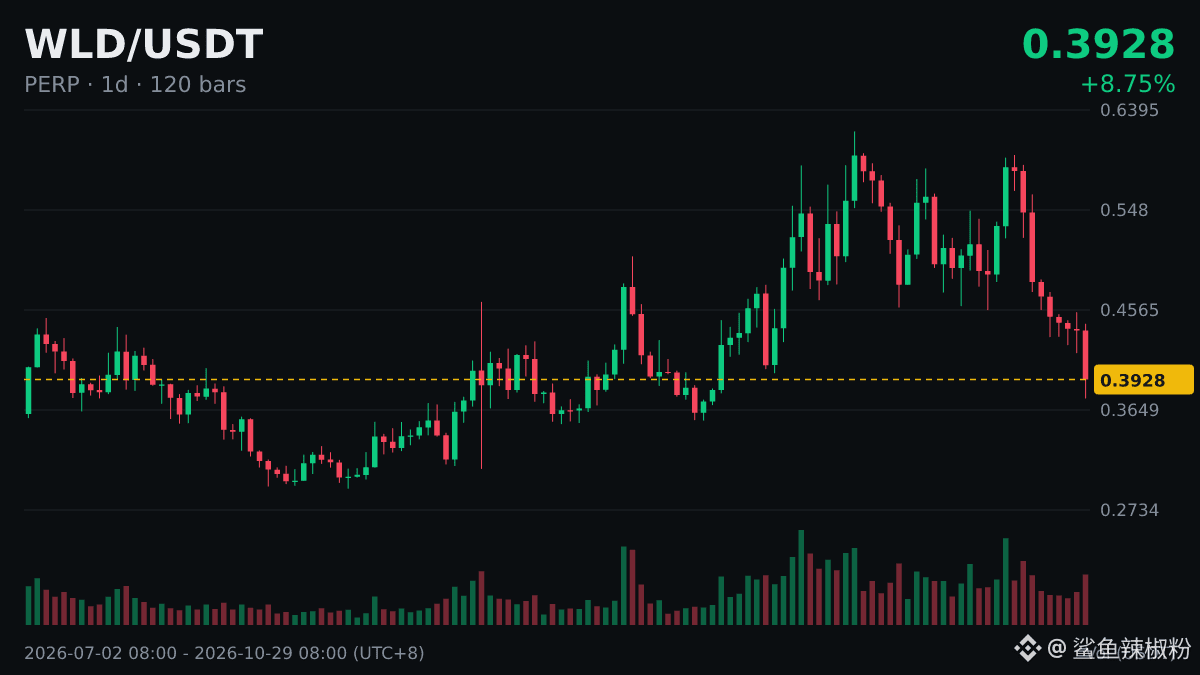
Technical Notes | $WLD | Daily chart breaks below MA200 | MA200 0.3959
Definition: One reason long-term moving averages like the MA200 attract so much attention is precisely that so many people watch them. When the price approaches this line, reactions are often more pronounced.
As for interpretation: whether trading volume increases when the price moves above or breaks below a moving average is also often used as a guide. A low-volume crossover is more likely to be just a temporary fluctuation.
Comparing several data points is more prudent than looking at just one, but even more indicators still cannot provide a definitive answer.
#WLD
Definition: One reason long-term moving averages like the MA200 attract so much attention is precisely that so many people watch them. When the price approaches this line, reactions are often more pronounced.
As for interpretation: whether trading volume increases when the price moves above or breaks below a moving average is also often used as a guide. A low-volume crossover is more likely to be just a temporary fluctuation.
Comparing several data points is more prudent than looking at just one, but even more indicators still cannot provide a definitive answer.
#WLD