

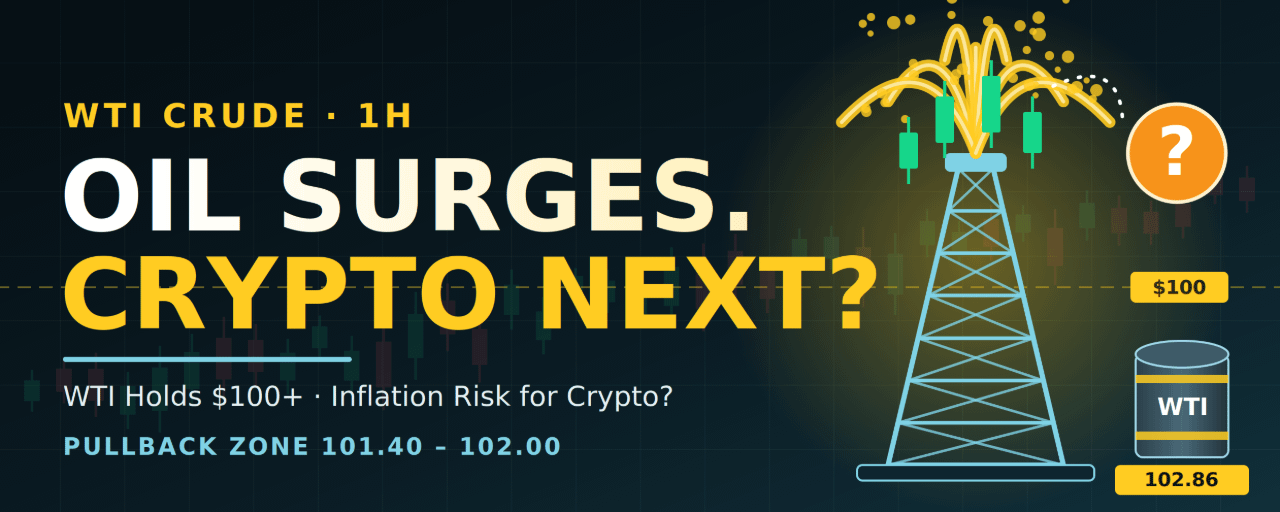


Chart: WTI Crude Oil, 1H, TradingView (TVC feed). Last price 102.86 (+0.10%). Time: Oct 29, 20:57 UTC.
What the oil chart shows
Big Higher Low at 99.25: on October 27, WTI bottomed near 99.25 and then rallied hard.
Higher High near 103.55: price pushed up on October 28, clearing the earlier Lower Highs around 102.7–103.0.
Pullback to a higher low: WTI then dipped to about 99.8 on October 29, which held above the 99.25 low, and rebounded sharply.
Now at resistance: price is at 102.86, just under the prior 103.0 area and the 103.55 high.
Fib levels: measured from the 103.59 high to the 99.25 low, retracements sit at about 101.93 (38.2%), 101.42 (50%) and 100.91 (61.8%). Bullish FVGs line up around 102.4–102.7, 101.4–101.7 and 100.9–101.2.
Your projected path: the white line points to about 107.4 by early November. Price is currently well below that line, so treat it as a target path, not support.
Major support: the marked level at 96.59 is the line the bulls must not lose.
Live cross-check
Live quotes agree closely with the chart. WTI settled around 102.20 on October 29, and other sources show it between roughly 100.85 and 102, with Brent near 110. WTI is up about 78% year to date and sits well above its 50-day (about 94) and 200-day (about 86) averages. The chart’s 102.86 at 20:57 UTC is in line with that. The backdrop is a supply shock tied to the Strait of Hormuz and the Iran conflict, so oil is headline-driven and can reverse sharply in either direction.
Oil trade plan (long bias)
Setup A: pullback entry (preferred)
Entry zone: 101.40–102.00, the 38.2%–50% retracement inside the FVGs
Stop loss: 100.60, below the 61.8% level and the lower FVG
TP1: 103.00
TP2: 103.60, the Higher High
TP3: 105.00
Extended target: 107.00
Setup B: breakout entry (smaller size)
Entry: a 1H candle close above 103.60, ideally with a retest as support
Stop loss: 102.70
Targets: 105.00, then 106.00, then 107.40
Measured from a 101.70 entry to the 100.60 stop, TP1 pays about 1.2R, TP2 about 1.7R, TP3 about 3R and the extended target about 4.8R. Setup B pays about 1.4R at the first target and about 3.7R at 107.40. After TP1, consider moving the stop to breakeven.
What invalidates it: a 1H close below 100.60 means the pullback zone failed. A break of the 99.25 Higher Low flips the structure bearish, with 96.59 as the next major support. Given the geopolitical headline risk, keep size modest.
Can oil’s move be the next move for crypto?
Not in the way bulls might hope. Here is how the link works:
Oil does not move crypto directly. It works through inflation, bond yields and the Fed. Higher oil feeds inflation expectations, which can delay rate cuts or even raise the odds of hikes, and tighter money is usually bad for risk assets like crypto.
The Fed just reminded us. It held rates at 3.75%–4.00% on October 28, and two members dissented in favor of a hike. Sustained oil strength would strengthen that hawkish camp.
There is precedent in recent weeks. On September 28, when oil climbed back above $100, Bitcoin fell about 1.8%, and several reports in recent months tie oil spikes to crypto dips.
But Bitcoin has been resilient. BTC held its channel support near 80,000 through the FOMC, so the market is not yet panicking.
So my read: a bullish oil chart is a risk factor for crypto, not a catalyst. If WTI breaks above 103.60 and pushes toward 107 while yields rise, expect pressure on BTC and especially on altcoins. If oil rolls over below 100.60, for example on any easing of the Hormuz situation, that would be relief for crypto, since the inflation worry would fade. The two often move in opposite directions in this kind of shock.
For traders, that means watching oil as a risk gauge: oil breaking out is a reason to tighten stops on crypto longs, and oil breaking down is a reason to be more confident on them.
Bottom line
Oil is bullish on the chart, with a Higher Low, a Higher High and demand underneath at 101.40–102.00. The best entry is a pullback there or a close above 103.60. But oil bulls are not crypto bulls right now. Treat a strong oil breakout as a warning for crypto, and a failed one as a tailwind.
⚠️ Disclaimer: This is not financial advice. This analysis is for educational and informational purposes only. Crypto and commodity markets are highly volatile, and you can lose your capital. Always do your own research, manage your risk, and never trade with money you can’t afford to lose.
@Binance Square Official #FedWatch #EarningsSeason #USMidtermElections #Binance #ChartSniper