#SPCX #trading #Investing 🚀🛡️
🛰️ LAST CALL AT REASONABLE PRICES?📊⚡
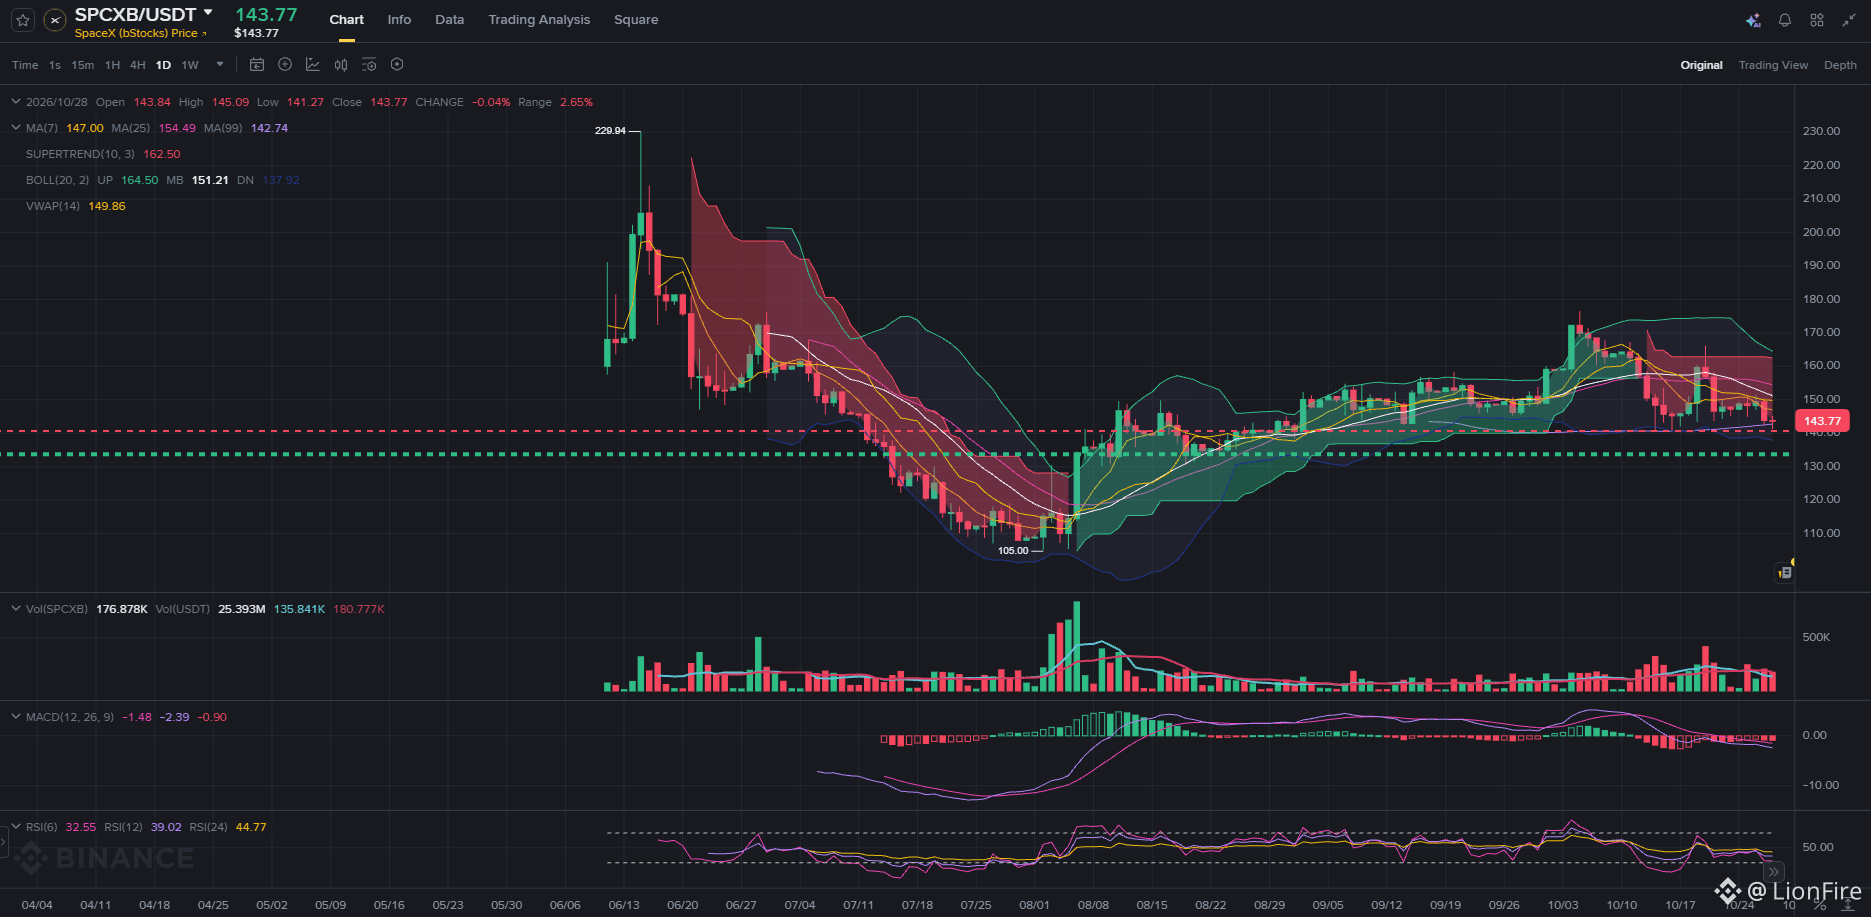
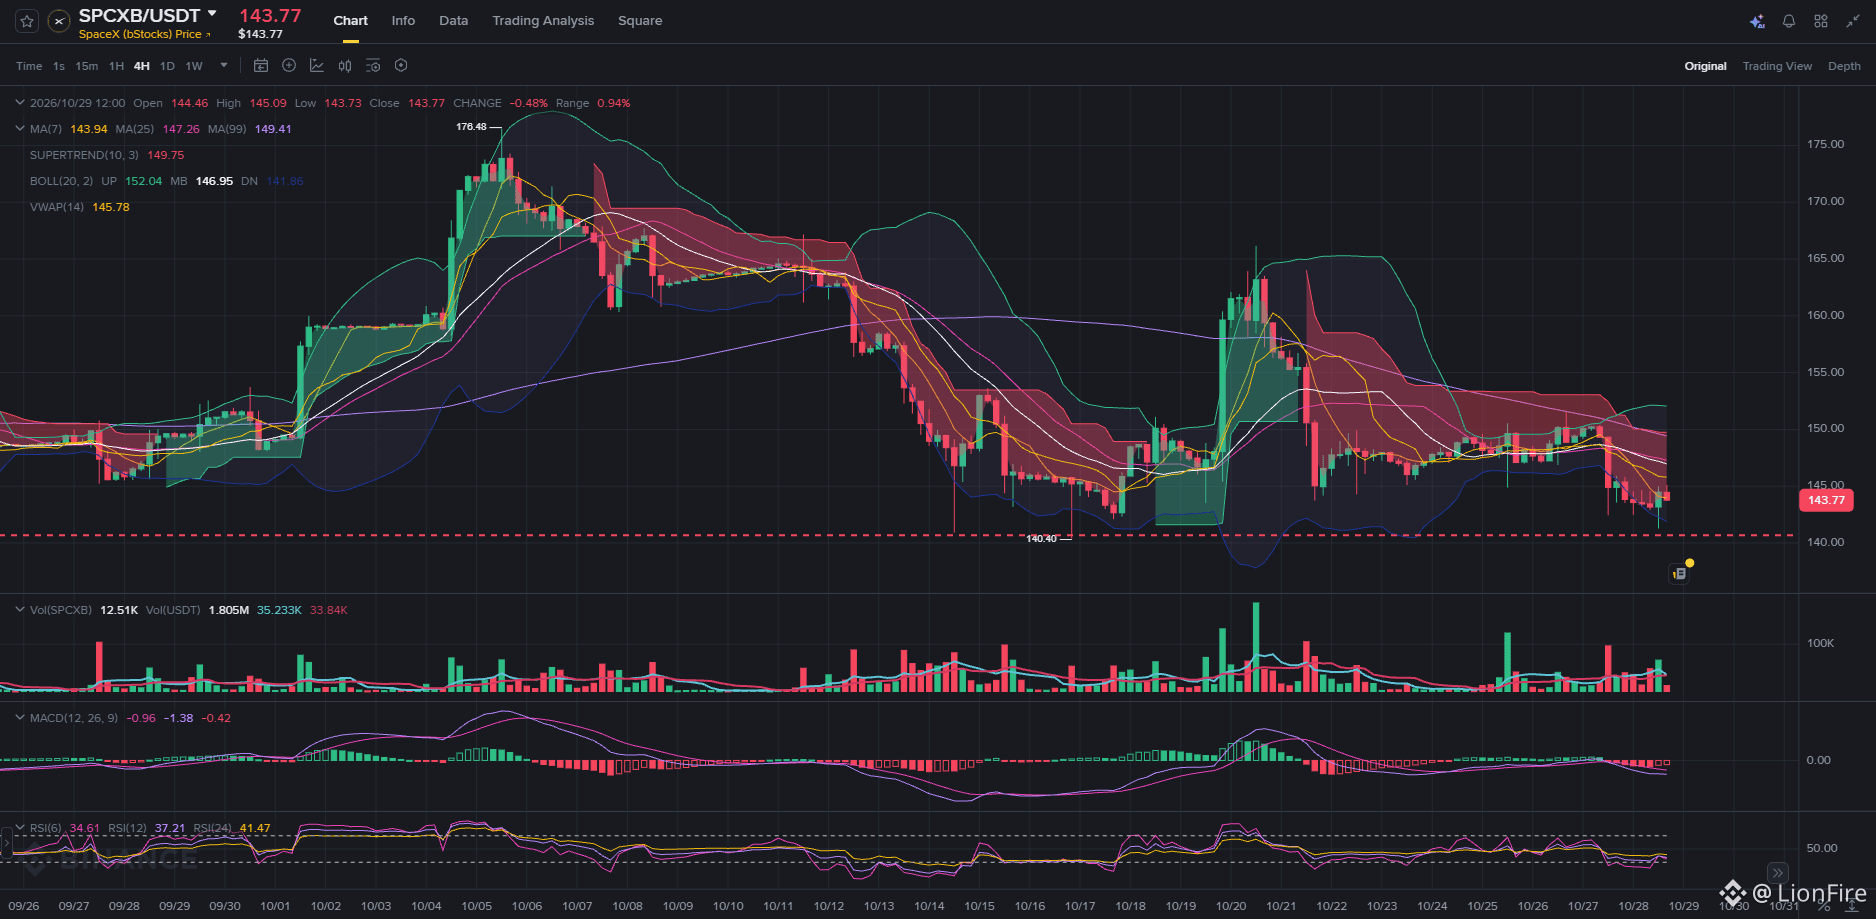
After the strong momentum that led SpaceX ($SPCXB) to mark a local peak at $176.40, the market has gone through a phase of digestion and orderly profit-taking. Today the price stands at $143.77, precisely retesting the red buy line (key zone between $140.40 and $143.00), which could represent one of the last accumulation windows at attractive multiples before a larger bullish consolidation.
🔍 1. Key technical confluence:
🧱 Defense above the red line ($140.40): On the 4-hour chart, the decline slows right as it touches the horizontal support where smart money defended the position in the previous purge.
🛡️ The dynamic support of the daily MA99: On the daily timeframe (1D), the 99-period moving average is located exactly at $142.74, serving as a firm structural floor that converges with the lower Bollinger band situated at $137.92.
📉 Indicators in oversold territory: The RSI(6) on the daily chart has fallen to 32.55 points, reflecting a clear exhaustion of selling pressure while volume bars begin to compress.
🧠 2. Strategic reading:
Entering in the heat of euphoria when an asset breaks through ceilings usually comes at a high price. By contrast, patiently waiting for the pullback toward support levels where the risk-reward ratio is favorable is what separates strategic traders from the rest.
If the price manages to consolidate this technical floor and the floating supply dries up completely above the red line, the current compression will lay the groundwork for the next expansion leg toward higher resistances.
💡 Buying opportunities at reasonable prices are not usually announced with trumpets; they usually arrive dressed in doubt and red consolidation candles. Execute the plan with discipline, manage the stop-loss rigorously, and keep a cool head! 🧠⚡