$ETH Crypto Academician: 10.30 Ethereum (ETH)—the true bottom has never been a single point, but a long lower shadow that makes you question everything
I’m still holding the position I opened going long at 2,300 yesterday; I haven’t touched it. Now the price has climbed to 2,372 and pulled back. Some traders are asking whether they should take profits first. Honestly, I’m not planning to. I entered at 2,300 because the daily Bollinger lower band around 2,297 looked like support, and the four-hour MACD was about to form a golden cross. The logic hasn’t changed, so why should I exit? I’m up more than 60 points now. Honestly, that’s not much, but I’ve built this position one trade at a time, at my own pace. My stop-loss is below 2,290. If it breaks, I’ll accept the loss; if not, I’ll hold and watch for 2,377, then 2,413. The rest is up to time.
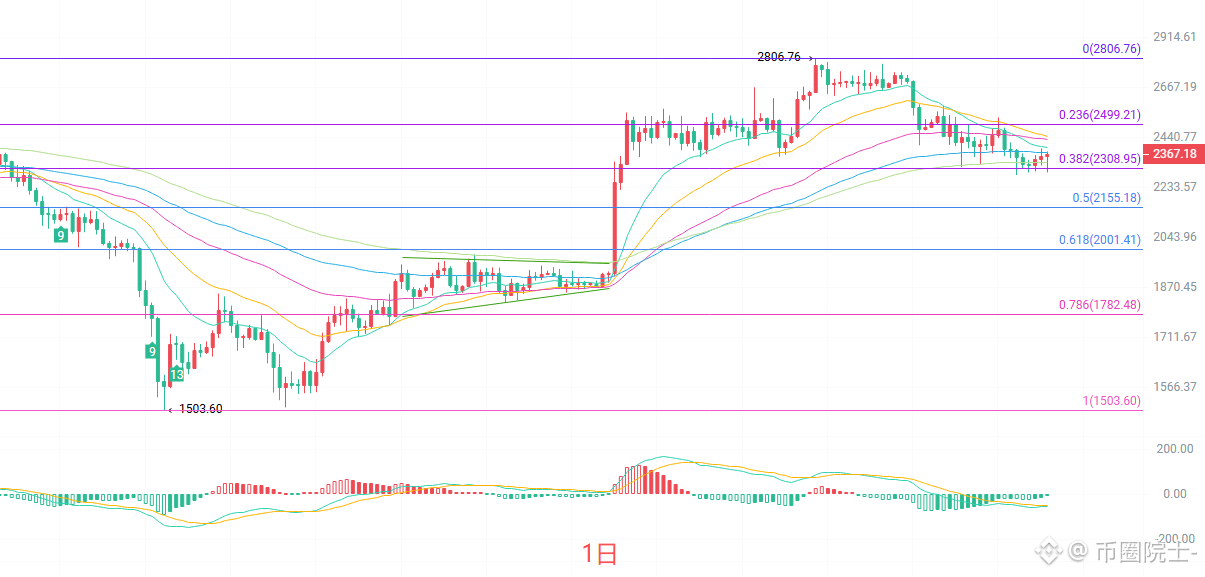
The daily candlestick has a long lower shadow, suggesting buyers are stepping in around 2,290. Looking at the moving averages: the price at 2,364 is above EMA120, but faces resistance from EMA15 at 2,397, EMA30 at 2,446, and EMA60 at 2,432. EMA90 at 2,377 is right above the current price. On the MACD, bearish momentum hasn’t fully played out, but the green bars are shortening, showing signs of convergence. The Bollinger middle band at 2,413 is resistance, while the lower band at 2,297 is support. Overall, the daily chart shows consolidation after a pullback from a high. The broader trend remains intact, but the market is still forming a short-term bottom.
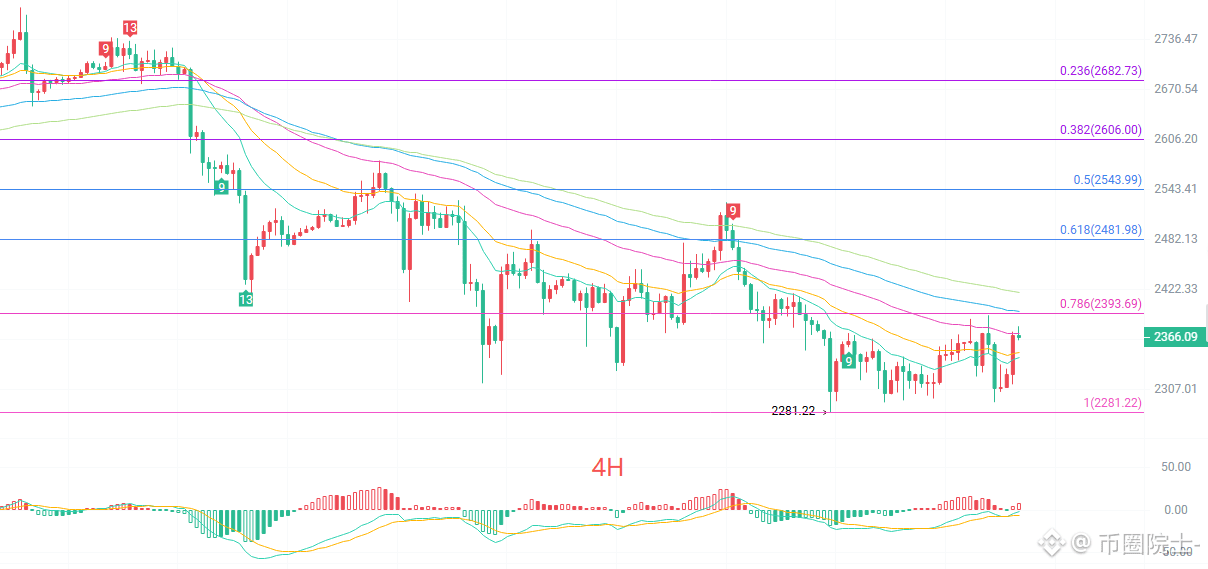
The four-hour chart looks much more positive than the daily chart. Looking at the moving averages: the price has moved above EMA15 and EMA30, but EMA60 at 2,371, EMA90 at 2,397, and EMA120 at 2,419 are still stacked overhead as resistance. On the MACD, DIF has crossed above DEA, signaling a short-term golden cross. The middle band at 2,336 is now below the price, while the upper band at 2,377 is right at today’s high. After the wick dipped to the previous low of 2,281, the four-hour chart staged a small V-shaped rebound. There is strength in the short-term rally, but the 2,377–2,400 area is a dense resistance zone. A clean break through it in one go is unlikely; a rally, pullback, and then another attempt is more likely.
Short-term reference:
Long: 2,340–2,300, if support holds; stop-loss 30 points; target 2,375–2,450
Short: 2,380–2,420, if momentum stalls; stop-loss 30 points; target 2,340–2,300
For specific trades, refer to real-time order-book data. For more information, you can contact the author. There may be a delay in publishing this article. This is for reference only; trade at your own risk.
#ETH走势分析 #ETH contracts