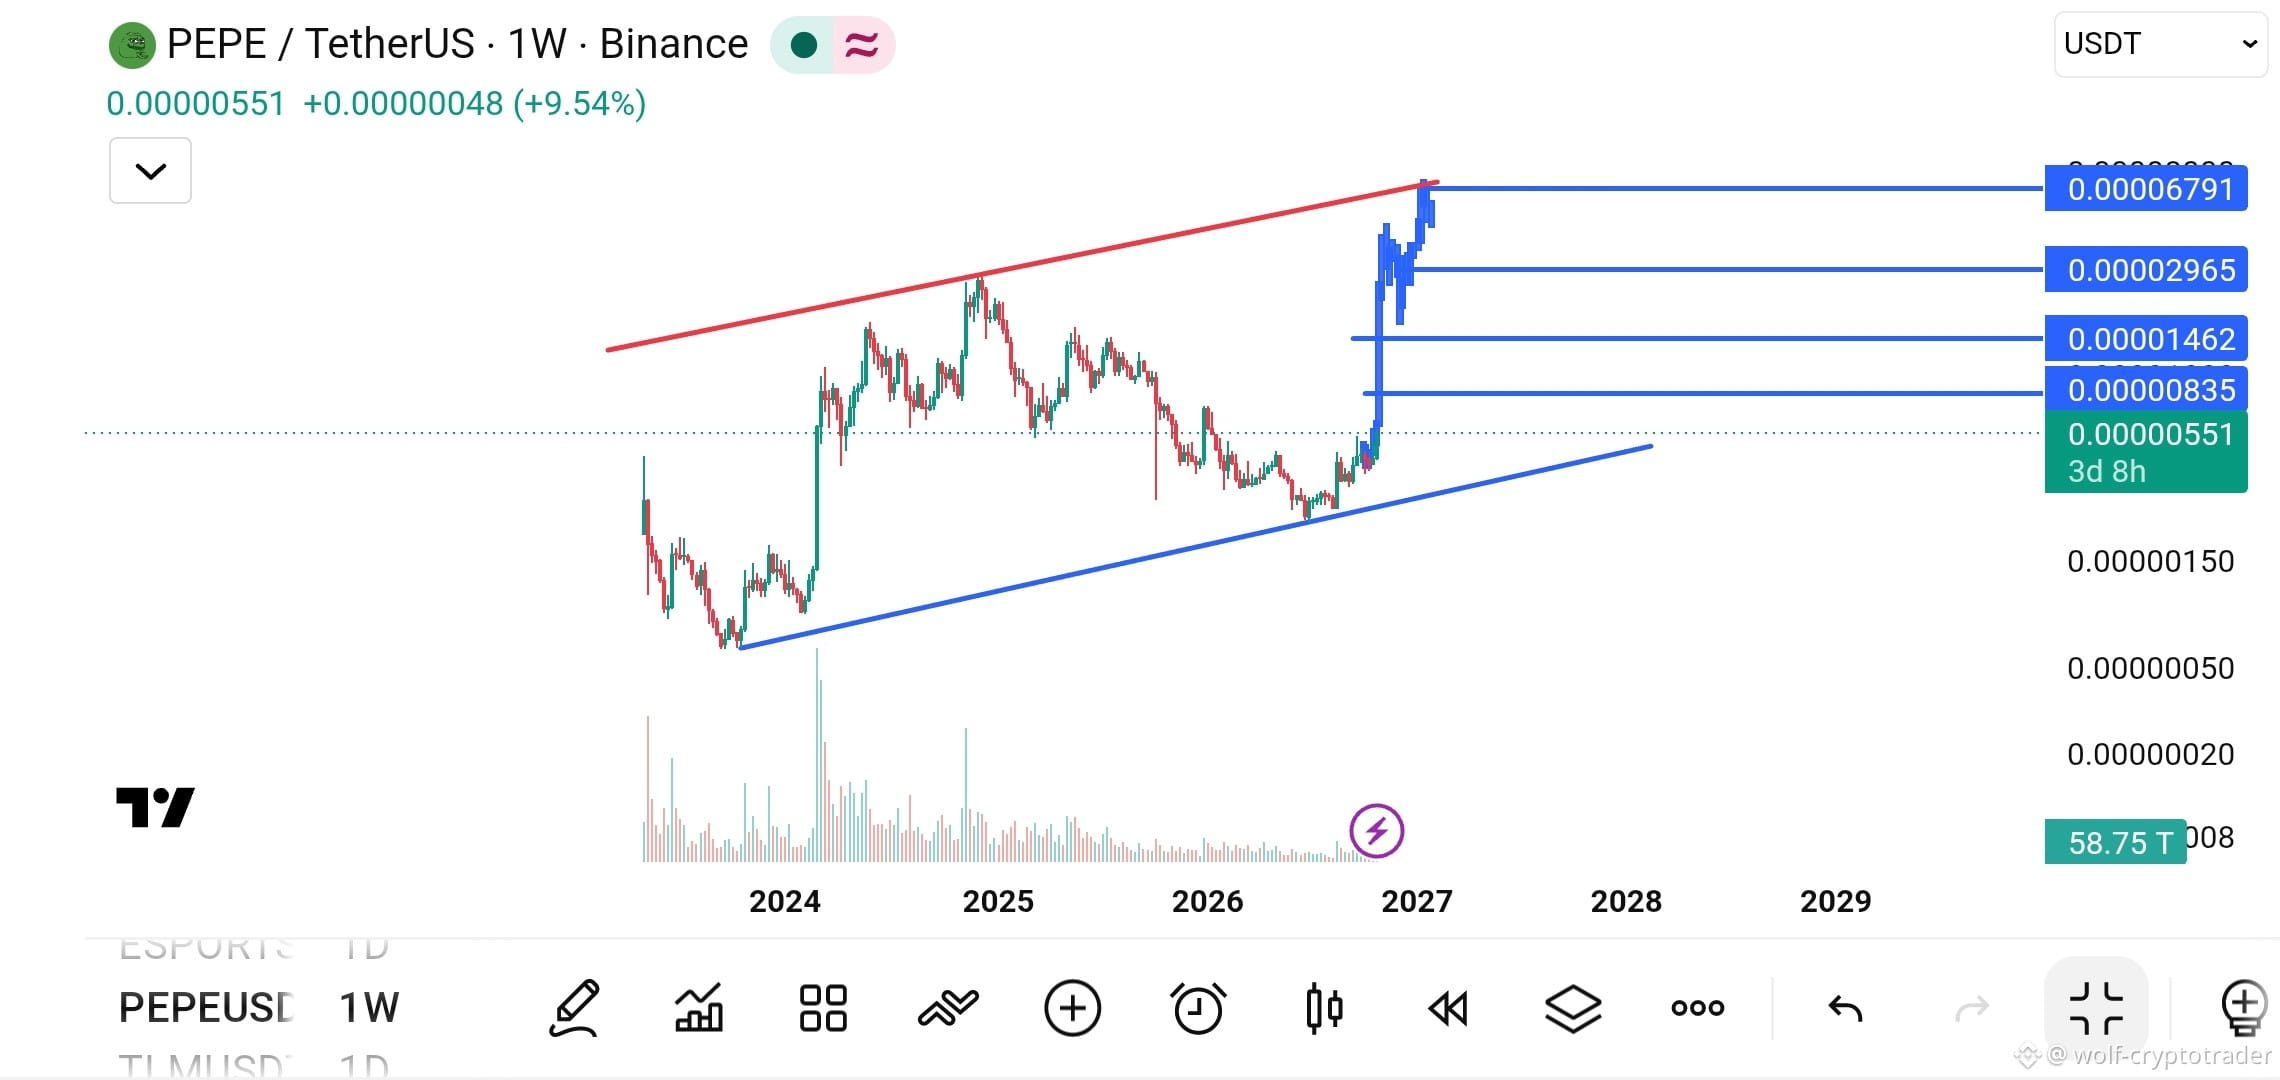
🧭 Major Support Lines: What Is PEPE’s Weekly Timeframe Hiding? 🐸📊
In technical analysis, the weekly timeframe (1W) never lies. When you look at the chart, you’re not seeing random price movements—you’re seeing “price geometry” built by the market over months.
Look at what’s happening with PEPE now. The price is reacting with remarkable precision to the lower boundary of the ascending channel (the lower blue line), bouncing strongly off it and settling at $0.00000551.
📊 Why is this technical structure so interesting?
🔹 Confirming the Bottom (Higher Low): Every time the price touches this lower line, it rejects further declines and starts moving up. This means smart money is defending this area and rejecting lower prices.