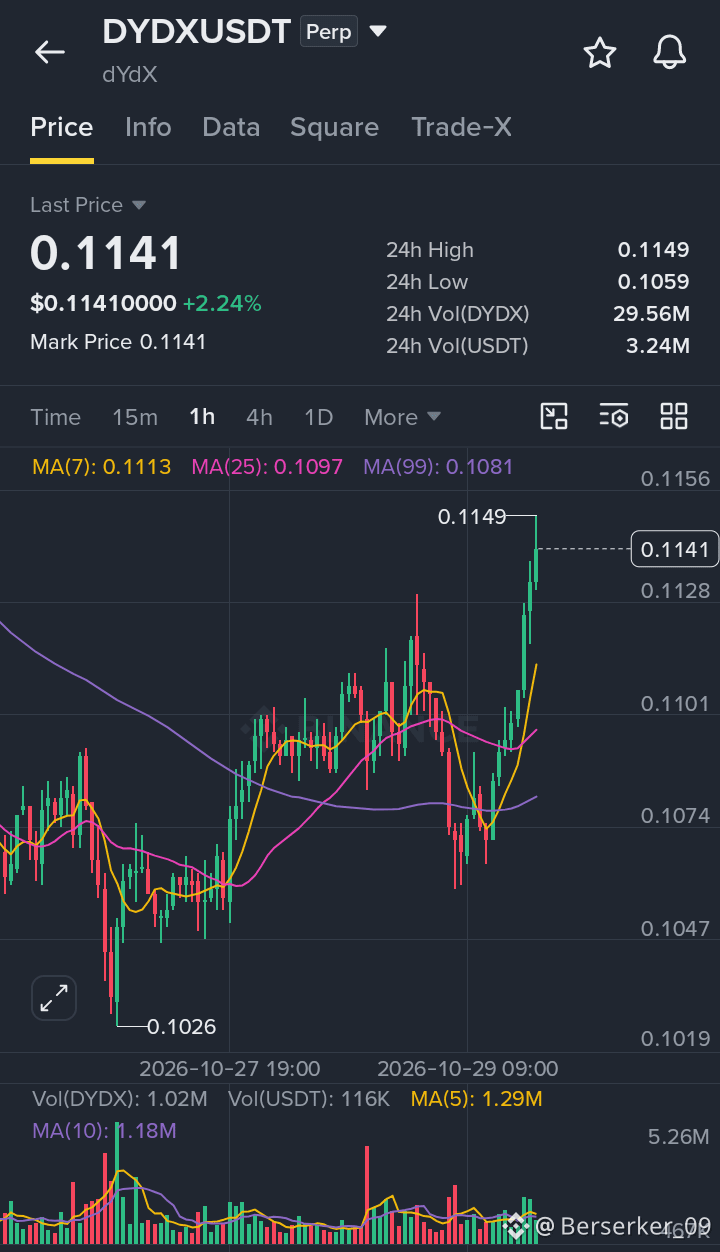
🚀 $DYDX — Bullish Reversal Gaining Momentum | Breakout Watch 🟢
LONG 🟢
📍 Entry Zone: $0.11280–$0.11340
🛑 Stop Loss (SL): $0.11100
🎯 Take Profit Target:
- TP1: $0.11550
📈 Market Analysis:
DYDX is showing a strong recovery on the 4H chart after bouncing from the $0.1030–$0.1050 support zone. Buyers are gradually pushing the price toward the $0.1140 resistance area, putting a potential bullish breakout in focus.
A confirmed move above resistance, supported by sustained buying pressure, could open the way toward the $0.11550 target. Watch how price behaves around $0.1140 before entering, as a failed breakout could lead to a pullback.
🔑 Key Levels:
- Support: $0.1030–$0.1050
- Resistance: $0.1140
- Bullish Confirmation: A sustained breakout above $0.1140
⚠️ Risk Note: Wait for breakout confirmation rather than chasing the move. Follow your stop loss and use a position size that fits your risk tolerance. The target is not guaranteed.
Bullish bias while buyers maintain momentum and resistance turns into support. 📈
Buy and Trade $DYDX here 👇
DYOR.