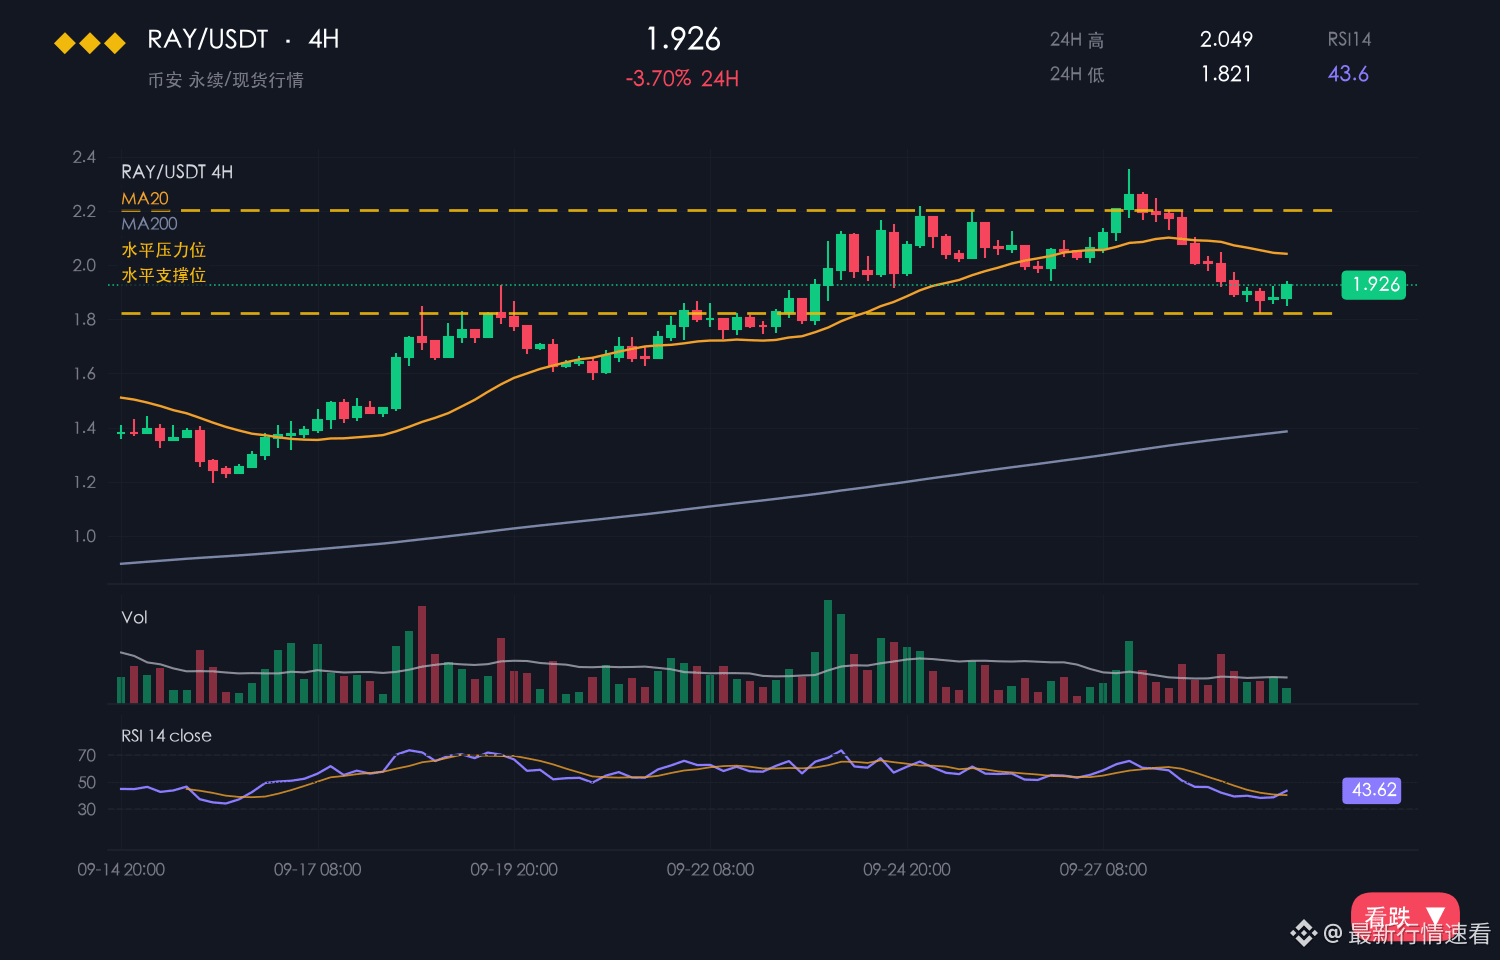
RAY is currently at 1.795, down 1.72% over 24 hours, still down 4.57% over 7 days, with an intraday range of 1.780–1.869 and an amplitude of 5.0%.
[Market]
Wow, I just opened it and saw RAY mysteriously dropping.
Before long it had moved to 1.780, with the amplitude widening to 5.0%.
RAY kept trending lower intraday from 1.780–1.869, and the rebound clearly lacked volume.
The rebound came on shrinking volume, while the decline came on expanding volume; the volume-price structure is bearish.
Putting BTC's -0.54% alongside it, RAY's trend is clearly weaker.
[Macro]
Overnight US stocks: Nasdaq +0.82%, S&P +0.70% (2026-10-27 close). BTC ETF saw a net outflow of about 45.2 billion USD this month, US CPI year-on-year rose 3.7%, above expectations, and the probability of a rate hike at the 2026-10-27/28 policy meeting is about 47%. Spot BTC ETF net outflows this month were about 45.2 billion USD, and institutional buying has cooled.
Short-term bias is bearish.
[Bearish reasons]
How did it fall? The market is just showing that 1.72% figure; I didn't look closely.
From 1.869 it slid all the way to around 1.795, and the short-term center of gravity is still moving down.
The center of gravity below 1.869 keeps drifting lower, and there is still no decent support for the short term.
If anyone knows, please explain.
In a bearish formation, rebounds tend to be choppy, so don't make the position too heavy.
For the short term, first see whether 1.780 can hold; if it breaks, take another look.
$RAY #RAY