$BTC has lost its H1 bullish structure, but spotting a downtrend doesn’t mean you should Short right near the bottom.
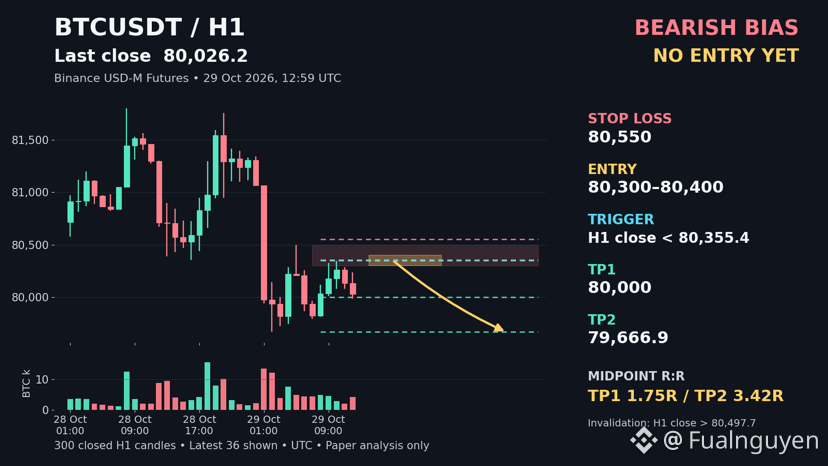
CHoCH below 80,822.6 and BOS below 80,355.4 were both confirmed by candle closes, with volume at 2.28× and 2.72× the average of the previous 20 candles, respectively, while rebound highs continue to decline.
According to Wyckoff, this could be a markdown phase after redistribution; according to SMC, sellers still have the advantage, but the latest volume was only 0.72×, so continued selling pressure isn’t particularly convincing yet.
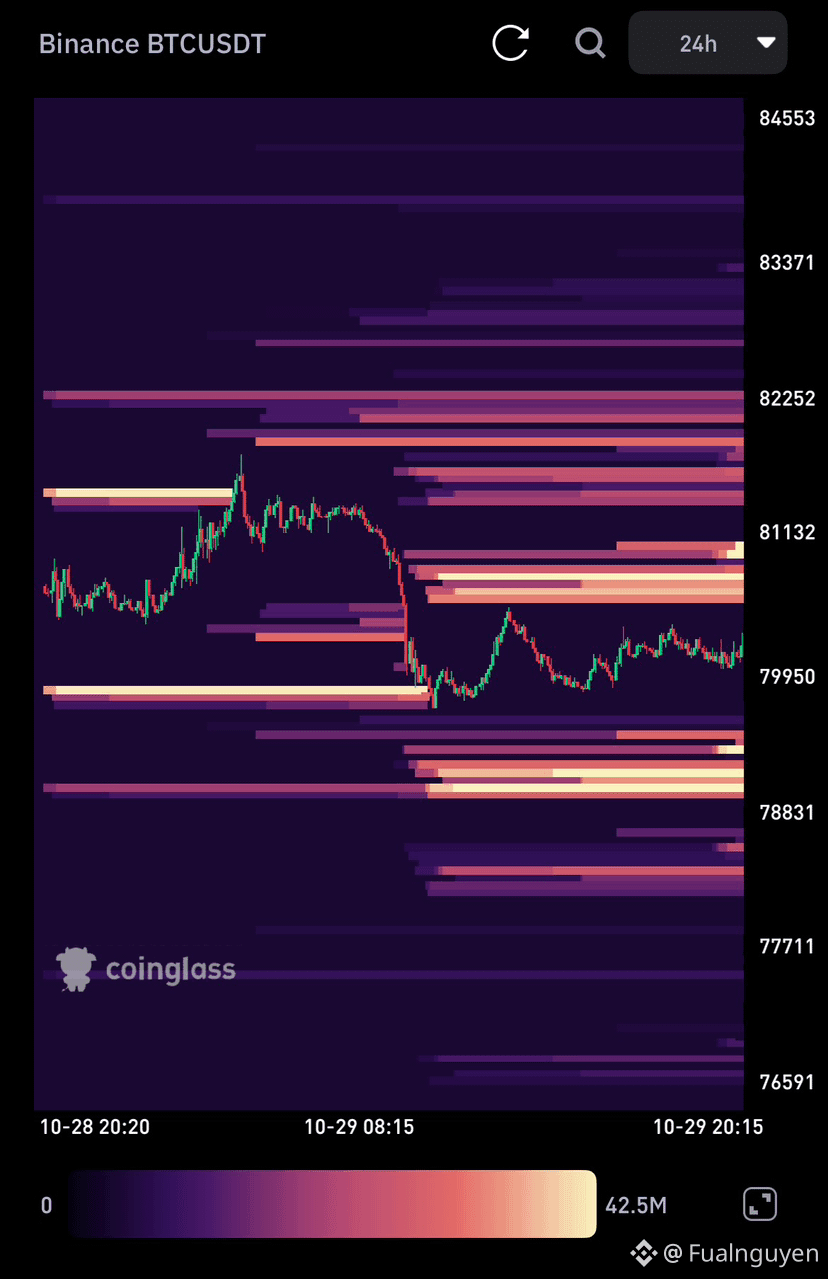
The heatmap shows estimated liquidity around 80,600–81,000 above and 79,000–79,400 below, creating a risk of positions being swept on either side rather than guaranteeing price will move straight down.
Bearish bias — no entry yet: will the next rebound continue to be rejected, or will those chasing Shorts pay the price before the market tests the lows?